Exam 9: Fundamentals of Hypothesis Testing: One-Sample Tests
Exam 1: Defining and Collecting Data200 Questions
Exam 2: Organizing and Visualizing189 Questions
Exam 3: Numerical Descriptive Measures80 Questions
Exam 4: Basic Probability108 Questions
Exam 5: Discrete Probability Distributions81 Questions
Exam 6: Conthe Tinuonormausl Disdis Tributionstribution and Other38 Questions
Exam 7: Sampling Distributions62 Questions
Exam 8: Confidence Interval Estimation139 Questions
Exam 9: Fundamentals of Hypothesis Testing: One-Sample Tests133 Questions
Exam 10: Two-Sample Tests95 Questions
Exam 11: Analysis of Variance73 Questions
Exam 12: Chi-Square and Nonparametric100 Questions
Exam 13: Simple Linear Regression89 Questions
Exam 14: Introduction to Multiple113 Questions
Exam 15: Multiple Regression62 Questions
Exam 16: Time-Series Forecasting61 Questions
Exam 17: Business Analytics102 Questions
Exam 18: A Roadmap for Analyzing Data133 Questions
Exam 19: Statistical Applications in Quality Management86 Questions
Exam 20: Decision Making121 Questions
Select questions type
True or False: In a hypothesis test, it is irrelevant whether the test is a one-tail or two-tail test.
(True/False)
4.8/5  (26)
(26)
SCENARIO 9-9
The president of a university claimed that the entering class this year appeared to be larger than the
entering class from previous years but their mean SAT score is lower than previous years.He took a
sample of 20 of this year's entering students and found that their mean SAT score is 1,501 with a
standard deviation of 53.The university's record indicates that the mean SAT score for entering
students from previous years is 1,520.He wants to find out if his claim is supported by the evidence
at a 5% level of significance.
-True or False: Referring to Scenario 9-9, if these data were used to perform a two-tail test, the
p-value would be 0.1254.
(True/False)
4.9/5 (44)
SCENARIO 9-2
A student claims that he can correctly identify whether a person is a business major or an agriculture
major by the way the person dresses.Suppose in actuality that if someone is a business major, he can
correctly identify that person as a business major 87% of the time.When a person is an agriculture
major, the student will incorrectly identify that person as a business major 16% of the time.Presented
with one person and asked to identify the major of this person (who is either a business or an
agriculture major), he considers this to be a hypothesis test with the null hypothesis being that the
person is a business major and the alternative that the person is an agriculture major.
-Referring to Scenario 9-2, what is the value of 
(Multiple Choice)
5.0/5 (25)
SCENARIO 9-9
The president of a university claimed that the entering class this year appeared to be larger than the
entering class from previous years but their mean SAT score is lower than previous years.He took a
sample of 20 of this year's entering students and found that their mean SAT score is 1,501 with a
standard deviation of 53.The university's record indicates that the mean SAT score for entering
students from previous years is 1,520.He wants to find out if his claim is supported by the evidence
at a 5% level of significance.
-Referring to Scenario 9-9, which of the following best describes the Type II error?
(Multiple Choice)
4.9/5 (27)
For a given sample size n, if the level of significance (α)is decreased, the power of the test
(Multiple Choice)
4.9/5 (37)
SCENARIO 9-3
An appliance manufacturer claims to have developed a compact microwave oven that consumes a
mean of no more than 250 W.From previous studies, it is believed that power consumption for
microwave ovens is normally distributed with a population standard deviation of 15 W.A consumer
group has decided to try to discover if the claim appears true.They take a sample of 20 microwave
ovens and find that they consume a mean of 257.3 W.
-True or False: Referring to Scenario 9-3, the consumer group can conclude that there is enough
evidence that the manufacturer's claim is not true when allowing for a 5% probability of
committing a Type I error.
(True/False)
4.9/5 (41)
SCENARIO 9-9
The president of a university claimed that the entering class this year appeared to be larger than the
entering class from previous years but their mean SAT score is lower than previous years.He took a
sample of 20 of this year's entering students and found that their mean SAT score is 1,501 with a
standard deviation of 53.The university's record indicates that the mean SAT score for entering
students from previous years is 1,520.He wants to find out if his claim is supported by the evidence
at a 5% level of significance.
-True or False: Referring to Scenario 9-9, the president can conclude that there is sufficient
evidence to show that the mean SAT score of the entering class this year is lower than previous
years with no more than a 10% probability of incorrectly rejecting the true null hypothesis.
(True/False)
4.8/5 (31)
True or False: A sample is used to obtain a 95% confidence interval for the mean of a population.
The confidence interval goes from 15 to 19.If the same sample had been used to test the null
hypothesis that the mean of the population is equal to 20 versus the alternative hypothesis that the
mean of the population differs from 20, the null hypothesis could be rejected at a level of
significance of 0.02.
(True/False)
4.9/5 (40)
True or False: The test statistic measures how close the computed sample statistic has come to the
hypothesized population parameter.
(True/False)
4.8/5 (40)
SCENARIO 9-2
A student claims that he can correctly identify whether a person is a business major or an agriculture
major by the way the person dresses.Suppose in actuality that if someone is a business major, he can
correctly identify that person as a business major 87% of the time.When a person is an agriculture
major, the student will incorrectly identify that person as a business major 16% of the time.Presented
with one person and asked to identify the major of this person (who is either a business or an
agriculture major), he considers this to be a hypothesis test with the null hypothesis being that the
person is a business major and the alternative that the person is an agriculture major.
-Referring to Scenario 9-2, what is the "actual level of significance" of the test?
(Multiple Choice)
4.7/5 (34)
SCENARIO 9-1
Microsoft Excel was used on a set of data involving the number of defective items found in a random
sample of 46 cases of light bulbs produced during a morning shift at a plant.A manager wants to
know if the mean number of defective bulbs per case is greater than 20 during the morning shift.She
will make her decision using a test with a level of significance of 0.10.The following information
was extracted from the Microsoft Excel output for the sample of 46 cases: 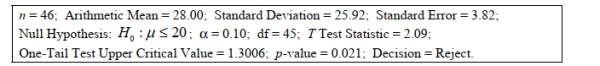 -True or False: Referring to Scenario 9-1, the null hypothesis would be rejected if a 5% probability
of committing a Type I error is allowed.
-True or False: Referring to Scenario 9-1, the null hypothesis would be rejected if a 5% probability
of committing a Type I error is allowed.
(True/False)
4.7/5 (32)
A pizza chain is considering opening a new store in an area that currently does not have any such
Stores.The chain will open if there is evidence that more than 5,000 of the 20,000 households in
The area have a favorable view of its brain.It conducts a telephone poll of 300 randomly selected
Households in the area and finds that 96 have a favorable view.State the test of hypothesis that is
Of interest to the pizza chain. 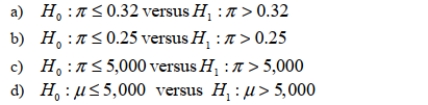
(Multiple Choice)
4.9/5 (31)
SCENARIO 9-7
A major home improvement store conducted its biggest brand recognition campaign in the company's
history.A series of new television advertisements featuring well-known entertainers and sports
figures were launched.A key metric for the success of television advertisements is the proportion of
viewers who "like the ads a lot".A study of 1,189 adults who viewed the ads reported that 230
indicated that they "like the ads a lot." The percentage of a typical television advertisement receiving
the "like the ads a lot" score is believed to be 22%.Company officials wanted to know if there is
evidence that the series of television advertisements are less successful than the typical ad (i.e.if there
is evidence that the population proportion of "like the ads a lot" for the company's ads is less than
-Referring to Scenario 9-7, what critical value should the company officials use to determine the
rejection region?
(Essay)
4.8/5 (40)
SCENARIO 9-9
The president of a university claimed that the entering class this year appeared to be larger than the
entering class from previous years but their mean SAT score is lower than previous years.He took a
sample of 20 of this year's entering students and found that their mean SAT score is 1,501 with a
standard deviation of 53.The university's record indicates that the mean SAT score for entering
students from previous years is 1,520.He wants to find out if his claim is supported by the evidence
at a 5% level of significance.
-Referring to Scenario 9-9, the population the president is interested in is:
(Multiple Choice)
4.8/5 (36)
SCENARIO 9-9
The president of a university claimed that the entering class this year appeared to be larger than the
entering class from previous years but their mean SAT score is lower than previous years.He took a
sample of 20 of this year's entering students and found that their mean SAT score is 1,501 with a
standard deviation of 53.The university's record indicates that the mean SAT score for entering
students from previous years is 1,520.He wants to find out if his claim is supported by the evidence
at a 5% level of significance.
-Referring to Scenario 9-9, state the alternative hypothesis for this study.
(Essay)
4.8/5 (36)
SCENARIO 9-2
A student claims that he can correctly identify whether a person is a business major or an agriculture
major by the way the person dresses.Suppose in actuality that if someone is a business major, he can
correctly identify that person as a business major 87% of the time.When a person is an agriculture
major, the student will incorrectly identify that person as a business major 16% of the time.Presented
with one person and asked to identify the major of this person (who is either a business or an
agriculture major), he considers this to be a hypothesis test with the null hypothesis being that the
person is a business major and the alternative that the person is an agriculture major.
-Referring to Scenario 9-2, what is the "actual confidence coefficient"?
(Multiple Choice)
4.9/5 (28)
Which of the following statements is not true about the level of significance in a hypothesis test?
(Multiple Choice)
4.8/5 (29)
SCENARIO 9-1
Microsoft Excel was used on a set of data involving the number of defective items found in a random
sample of 46 cases of light bulbs produced during a morning shift at a plant.A manager wants to
know if the mean number of defective bulbs per case is greater than 20 during the morning shift.She
will make her decision using a test with a level of significance of 0.10.The following information
was extracted from the Microsoft Excel output for the sample of 46 cases:
-True or False: Referring to Scenario 9-1, the evidence proves beyond a doubt that the mean
number of defective bulbs per case is greater than 20 during the morning shift.
(True/False)
4.8/5 (35)
SCENARIO 9-4
A drug company is considering marketing a new local anesthetic.The effective time of the anesthetic
the drug company is currently producing has a normal distribution with an mean of 7.4 minutes with a
standard deviation of 1.2 minutes.The chemistry of the new anesthetic is such that the effective time
should be normally distributed with the same standard deviation, but the mean effective time may be
lower.If it is lower, the drug company will market the new anesthetic; otherwise, they will continue
to produce the older one.A sample of size 36 results in a sample mean of 7.1.A hypothesis test will
be done to help make the decision.
-Referring to Scenario 9-4, the value of the test statistic is ________.
(Essay)
4.9/5 (33)
Filters
- Essay(0)
- Multiple Choice(0)
- Short Answer(0)
- True False(0)
- Matching(0)