Exam 9: Testing the Difference Between Two Means, Two Variances, and Two Proportions
Exam 1: The Nature of Probability and Statistics81 Questions
Exam 2: Frequency Distributions and Graphs107 Questions
Exam 3: Data Description127 Questions
Exam 4: Probability and Counting Rules173 Questions
Exam 5: Discrete Probability Distributions117 Questions
Exam 6: The Normal Distribution114 Questions
Exam 7: Confidence Intervals and Sample Size122 Questions
Exam 8: Hypothesis Testing178 Questions
Exam 9: Testing the Difference Between Two Means, Two Variances, and Two Proportions99 Questions
Exam 10: Correlation and Regression73 Questions
Exam 11: Other Chi-Square Tests73 Questions
Exam 12: Analysis of Variance69 Questions
Exam 13: Nonparametric Statistics62 Questions
Exam 14: Sampling and Simulation58 Questions
Select questions type
An field researcher is gathering data on the trunk diameters of mature pine and spruce trees in a certain area. The following are the results of his random sampling. Can he conclude, at , that the average trunk diameter of a pine tree is greater than the average diameter ofa spruce tree?
Pine trees Spruce trees Sample size 60 80 Mean trunk diameter, cm 46 40 Population variance 155 127
(Multiple Choice)
4.9/5  (29)
(29)
A researcher wanted to determine if using an octane booster would increase gasoline mileage. A random sample of seven cars was selected; the cars were driven for two weeks without the booster and two weeks with the booster. Use the definitions of and as given in the table. Consequently, .
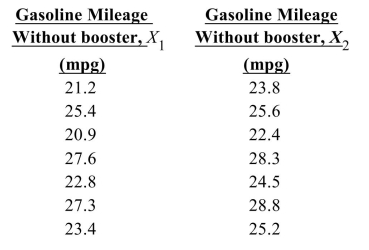 State the alternative hypothesis.
(Multiple Choice)
4.9/5 (41)
For the samples summarized below, test the hypothesis, at , that the two variance are different.
Sample 1 Sample 2 Sample Std. Deviation 4.1 2.7 Sample size 10 20
(Multiple Choice)
4.9/5 (38)
In an experiment to determine whether there is a systematic difference between the weigh obtained with two different mass balances, six specimens were weighed, in grams, on eac balance. The following data were obtained:
Specimen 1 6.05 6.01 2 8.00 8.02 3 13.45 13.43 4 7.47 7.48 5 6.53 6.52 6 14.38 14.38
State a conclusion using the level of significance.
(Multiple Choice)
4.8/5 (43)
A conservationist suspects that the water level in Horseshoe Lake has been affected more by the current drought than the water level in Swan Lake, so he measures how far the water level is below normal each day in June. The data are normally distributed. Test his hypothesis at .
Horseshoe Lake Swan Lake =43.0 =38.6 =3.2 =2.4 =30 =30
(Essay)
4.7/5 (34)
A survey found that in a random sample of 72 families, 21 owned dogs. A survey done 15 years ago found that in a random sample of 63 families, 28 owned dogs. At , has the proportion of dog owners changed over the 15 -year period? USe the -value method.
(Multiple Choice)
4.9/5 (46)
Many elementary school students in a school district currently have ear infections. A random sample of children in two different schools found that 16 of 42 at one school and
17 of 30 at the other have ear infections. At the 0.05 level of significance, is there
Sufficient evidence to support the claim that a difference exists between the proportions
Of students who have ear infections at the two schools?
(Multiple Choice)
4.8/5 (34)
The football coach at State University wishes to determine if there is a decrease in offensi production between the first half and the second half of his team's recent games. The tabli shows the first-half and second-half offensive production (measured in total yards gained for the past six games.
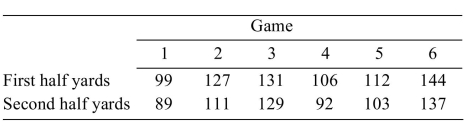 State a conclusion using the level of significance,
(Multiple Choice)
4.9/5 (39)
A test was made of versus . The sample means were and , the sample standard deviations were and , and the sample sizes were and .
Compute the value of the test statistic.
(Multiple Choice)
4.8/5 (45)
For the samples summarized below, test the hypothesis that the two variances are equal, at
Sample 1 Sample 2 Sample variance 25 10 Sample size 7 17
(Multiple Choice)
4.9/5 (28)
The bowling scores of a professional bowler during a two-day tournament are shown belo
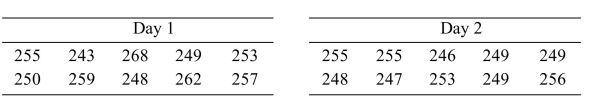 Can you conclude that the variability of the scores is greater on the second day than on thi first day? Use the level of significance.
(Multiple Choice)
4.9/5 (39)
A medical researcher is interested in whether patients' left arms or right arms are longer. If 9 patients participate in this study, how many degrees of freedom should the researcher use when finding the critical value for a test?
(Multiple Choice)
4.8/5 (36)
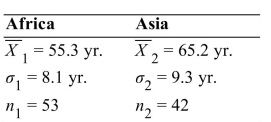
A sociologist wants to determine if the life expectancy of people in Africa is less than the expectancy of people in Asia. The data obtained is shown in the table below.
Africa Asia =63.3. =65.2. =9.1. =7.3. =120 =150
What is the test value?
(Multiple Choice)
4.9/5 (40)
The football coach at State University wishes to determine if there is a decrease in offensive production between the first half and the second half of his team's recent games. The table below shows the first-half and second-half offensive production (measured in total yards gained per half) for the past six games.
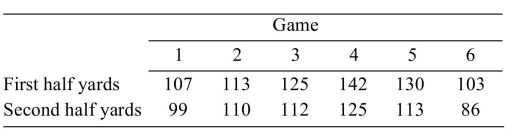 Can you conclude that the mean offensive production in the first half differed fron the second half?
i). State the null and alternative hypotheses.
ii). Compute the test statistic.
iii). State a conclusion using the level of significance.
Can you conclude that the mean offensive production in the first half differed fron the second half?
i). State the null and alternative hypotheses.
ii). Compute the test statistic.
iii). State a conclusion using the level of significance.
(Essay)
4.9/5 (31)
Are low-fat diets or low-carb diets more effective for weight loss? A sample of 70 subjects went on a low-carbohydrate diet for six months. At the end of that time, the sample mean weight loss was pounds with a sample standard deviation of pounds. A second sample of 76 subjects went on a low-fat diet. Their sample mean weight loss was with a standard deviation of 7.26. Can you conclude that the mean weight loss differed between the two diets? Use the . level.
i). State the appropriate null and alternate hypotheses.
ii). Compute the test statistic.
iii). How many degrees of freedom are there, using the simple method?
iv). Do you reject ? State a conclusion.
(Essay)
4.8/5 (40)
A sociologist expects the life expectancy of people in Africa is different than the life expectancy of people in Asia. The data obtained is shown in the table below. Determine the confidence interval for the difference in the population means.
(Multiple Choice)
4.8/5 (31)
In an experiment to determine whether there is a systematic difference between thi weights obtained with two different mass balances, six specimens were weighed, grams, on each balance. The following data were obtained:
Specimen 1 13.72 13.71 2 8.76 8.75 3 10.99 11.00 4 7.20 7.18 5 9.91 9.90 6 12.73 12.71
Can you conclude that the mean weight differs between the two balances?
i). State the null and alternative hypotheses.
ii). Compute the test statistic.
iii). State a conclusion using the level of significance.
(Essay)
4.9/5 (40)
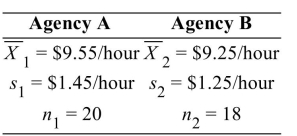
The Donaldson Corporation wants to hire a temporary secretary. There are two employment agencies in town, and it is believed that the average hourly wage charged by both agencies is the same. A Donaldson manager surveyed other employers in town to find what they paid the agencies for temporary secretaries. The results are summarized below. At , test the claim that each agency charges the same hourly wage.
(Essay)
4.8/5 (42)
A group of college students believes the average grades in psychology courses are different than the average grades in biology courses. The group found the average
Psychology grades of a sample of 11 students was 82.4 and the average biology grades of
A sample of 11 students was 81.2. What is the null hypothesis for this study?
(Multiple Choice)
4.9/5 (37)
Filters
- Essay(0)
- Multiple Choice(0)
- Short Answer(0)
- True False(0)
- Matching(0)