Exam 2: Summarizing and Graphing Data
Exam 1: Introduction to Statistics106 Questions
Exam 2: Summarizing and Graphing Data85 Questions
Exam 3: Statistics for Describing, Exploring, and Comparing Data187 Questions
Exam 4: Probability186 Questions
Exam 5: Discrete Probability Distributions155 Questions
Exam 6: Normal Probability Distributions227 Questions
Exam 7: Estimates and Sample Size141 Questions
Exam 8: Hypothesis Testing139 Questions
Exam 9: Inferences From Two Samples133 Questions
Exam 10: Correlation and Regression104 Questions
Exam 11: Chi-Square and Analysis of Variance65 Questions
Select questions type
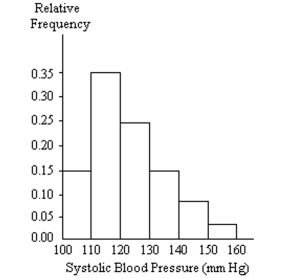
A nurse measured the blood pressure of each person who visited her clinic. Following is a relative-frequency histogram for the systolic blood pressure readings for those people aged between 25 and 40. The blood pressure readings were given to the nearest whole number.
Approximately what percentage of the people aged 25-40 had a systolic blood pressure reading between 110 and 139 inclusive?
Free
(Multiple Choice)
4.7/5  (35)
(35)
Correct Answer: Verified
B
A store manager counts the number of customers who make a purchase in his store each day. The data are as follows.
5 6 3 9 2 5 5 6 3 2
Free
(Multiple Choice)
4.8/5 (34)
Correct Answer:Verified
D
A car dealer is deciding what kinds of vehicles he should order from the factory. He looks at his sales report for the preceding period. Choose the vertical scale so that the relative frequencies are represented.
Vehicle Sales Economy 30 Sports 7.5 Family 52.5 Luxury 15 Truck 45
 Construct a Pareto chart to help him decide.
Free
(Multiple Choice)
4.8/5 (39)
Correct Answer:Verified
B
Use the given data to construct a frequency distribution.
-Kevin asked some of his friends how many hours they had worked during the previous week at their after-school jobs. The results are shown below. 6 6 6 4 6 6 9 8 6 3 8 6 6 8 6 6 8 6 6 8 6 8 8 4
Construct a frequency distribution. Use 4 classes, a class width of 2 hours, and a lower limit of 3 for class 1.
Hours Frequency
(Essay)
4.9/5 (28)
In a survey, 20 people were asked how many magazines they had purchased during the previous year. The results are shown below. Construct a histogram to represent the data.
Use 4 classes with a class width of 10, and begin with a lower class limit of -0.5. What is the approximate amount at the center?
6 15 3 36 25 18 12 18 5 30 24 7 0 22 33 24 19 4 12 9
(Essay)
4.7/5 (34)
The frequency distribution below summarizes the home sale prices in the city of Summerhill for the month of June. Determine the width of each class.
(Multiple Choice)
4.9/5 (33)
The histogram below represents the number of television sets per household for a sample of U.S. households. How many households are included in the histogram? 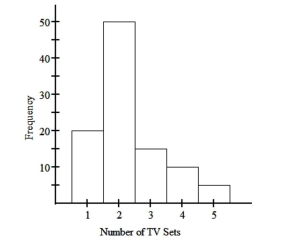
(Multiple Choice)
4.7/5 (34)
Sturges' guideline suggests that when constructing a frequency distribution, the ideal number of classes can be approximated by where n is the number of data values. Use this
Guideline to find the ideal number of classes when the number of data values is 180.
(Multiple Choice)
4.7/5 (34)
0.21 0.06 0.58 0.14 0.31 0.64 0.5 0.39 y 0.64 0.58 0.91 0.31 -0.59 0.95 0.97 -0.26
(Multiple Choice)
4.9/5 (36)
Suppose you are comparing frequency data for two different groups, 25 managers and 150 blue collar workers. Why would a relative frequency distribution be better than a frequency distribution?
(Essay)
4.9/5 (34)
The histogram below shows the distribution of the assets (in millions of dollars) of 71 companies. Does the distribution appear to be normal? 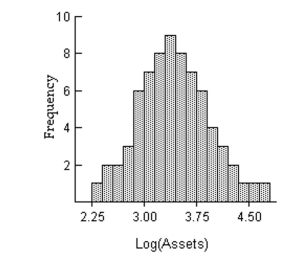
(Short Answer)
4.9/5 (32)
Use the given paired data to construct a scatterplot.
- x -5 -7 -2 -4 2 5 1 7 -4 -1 y 3 -6 1 3 4 -2 -2 1 -7 -4
(Multiple Choice)
4.8/5 (41)
Suppose that a data set has a minimum value of 18 and a maximum of 83 and that you want 5 classes. Explain how to find the class width for this frequency table. What happens if you mistakenly use a class width of 13 instead of 14?
(Essay)
4.8/5 (37)
The ages of the 45 members of a track and field team are listed below. Construct an expanded stemplot with about 8 rows. 21 18 42 35 32 21 44 25 38 48 14 19 23 22 28
32 34 27 31 17 16 41 37 22 24 33 32 21 26 30
22 27 32 30 20 18 17 21 15 26 36 31 40 16 25
(Multiple Choice)
4.9/5 (37)
The following frequency distribution analyzes the scores on a math test. Find the class boundaries of scores interval 40-59.
Scores Number of students 40-59 2 60-75 4 76-82 6 83-94 15 95-99 5
(Multiple Choice)
4.8/5 (30)
Create an example displaying data in a pie chart. Display the same data in a Pareto chart.
Which graph is more effective? List at least two reasons in support of your choice.
(Essay)
4.8/5 (36)
Attendance records at a school show the number of days each student was absent during the year. The days absent for each student were as follows. 0 2 3 4 2 3 4 6 7 2 3 4 6 9 8
(Multiple Choice)
4.8/5 (34)
Use the given data to construct a frequency distribution.
-The following figures represent Jennifer's monthly charges for long distance telephone calls for the past twelve months.
7.33 11.26 13.54 17.00 10.56 16.15 9.59 15.08 14.50 15.28 14.88 12.41
Construct a frequency distribution with 4 classes.
Charges Frequency
(Essay)
4.9/5 (35)
The frequency distribution below summarizes the home sale prices in the city of Summerhill for the month of June. Determine the class midpoint for class 235.0-265.9.
(Multiple Choice)
4.8/5 (29)
The Kappa Iota Sigma Fraternity polled its members on the weekend party theme. The vote was as follows: six for toga, four for hayride, eight for beer bash, and two for masquerade. Display the vote count in a Pareto chart.
(Multiple Choice)
4.9/5 (31)
Filters
- Essay(0)
- Multiple Choice(0)
- Short Answer(0)
- True False(0)
- Matching(0)