Exam 2: Summarizing and Graphing Data
Exam 1: Introduction to Statistics106 Questions
Exam 2: Summarizing and Graphing Data85 Questions
Exam 3: Statistics for Describing, Exploring, and Comparing Data187 Questions
Exam 4: Probability186 Questions
Exam 5: Discrete Probability Distributions155 Questions
Exam 6: Normal Probability Distributions227 Questions
Exam 7: Estimates and Sample Size141 Questions
Exam 8: Hypothesis Testing139 Questions
Exam 9: Inferences From Two Samples133 Questions
Exam 10: Correlation and Regression104 Questions
Exam 11: Chi-Square and Analysis of Variance65 Questions
Select questions type
In a survey, 26 voters were asked their ages. The results are shown below. Construct a histogram to represent the data (with 5 classes beginning with a lower class limit of 19.5 and a class width of 10). What is the approximate age at the center? 43 56 28 63 67 66 52 48 37 51 40 60 62 66 45 21 35 49 32 53 61 53 69 31 48 59
(Essay)
4.8/5  (41)
(41)
The following data consists of the weights (in pounds) of 15 randomly selected women and the weights of 15 randomly selected men. Construct a back-to-back stemplot for the data. Women: 128 150 118 166 142 122 137 110 175 152 145 126 139 111 170 Men: 140 153 199 186 169 136 176 162 196 155 173 190 141 166 153
(Multiple Choice)
4.9/5 (34)
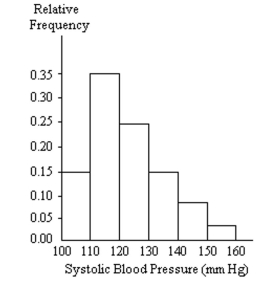
A nurse measured the blood pressure of each person who visited her clinic. Following is a relative-frequency histogram for the systolic blood pressure readings for those people aged between 25 and 40. The blood pressure readings were given to the nearest whole number.
Approximately what percentage of the people aged 25-40 had a systolic blood pressure reading between 110 and 119 inclusive? 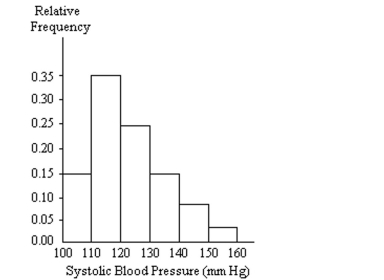
(Multiple Choice)
4.9/5 (36)
At the National Criminologists Association's annual convention, participants filled out a questionnaire asking what they thought was the most important cause for criminal behavior. The Tally was as follows.
Cause Frequency education 47.1 drugs 141.3 family 94.2 poverty 164.85 other 23.55
 Construct a Pareto chart to display these findings.
(Multiple Choice)
4.9/5 (31)
A college student wants to purchase one of two stocks. She has the average annual high values for each of these stocks over the most recent ten-year period. For comparison, she decides to sketch a time-series graph. How should she prepare her graph, and what should she look for?
(Essay)
4.9/5 (37)
Use the given paired data to construct a scatterplot.
- x -4 2 8 10 12 8 5 -3 -2 y 3 7 11 10 9 6 7 3 2
(Multiple Choice)
4.8/5 (30)
Construct a frequency distribution and the corresponding histogram in which the following conditions are satisfied:
- The frequency for the second class is twice the frequency of the first class.
- In the histogram, the area of the bar corresponding to the second class is four times the area of the bar corresponding to the first class.
(Essay)
4.8/5 (38)
The scores on a recent statistics test are given in the frequency distribution below. Construct the corresponding relative frequency distribution. Round relative frequencies to the nearest hundredth of a percent if necessary.
Scores Frequency 0-60 5 61-70 10 71-80 8 81-90 6 91-100 2
(Multiple Choice)
4.8/5 (28)
The frequency distribution for the weekly incomes of students with part-time jobs is given below. Construct the corresponding relative frequency distribution. Round relative frequencies to the nearest hundredth of a percent if necessary.
(Multiple Choice)
4.7/5 (36)
A nurse measured the blood pressure of each person who visited her clinic. Following is a relative-frequency histogram for the systolic blood pressure readings for those people aged between 25 and 40. The blood pressure readings were given to the nearest whole number. What class width was used to construct the relative frequency distribution?
(Multiple Choice)
4.8/5 (37)
Use the given data to construct a frequency distribution.
-A school district performed a study to find the main causes leading to its students dropping out of school. Thirty cases were analyzed, and a primary cause was assigned to each case. The causes included unexcused absences (U), illness (I), family problems (F), and other causes (O). The results for the thirty cases are listed below:
Construct a table summarizing the frequency distribution of the primary causes leading to student dropout.
Cause Frequency
(Essay)
4.7/5 (35)
The histogram below represents the number of television sets per household for a sample of U.S. households. What is the class width? 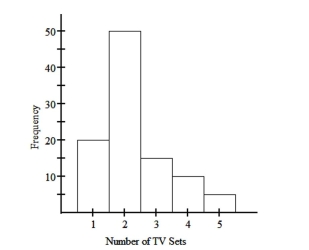
(Multiple Choice)
4.7/5 (30)
One purpose of displaying data graphically is to provide clues about trends. The given values are weights (ounces) of steaks listed on a restaurant menu as "20 ounce porterhouse" steaks. The weights are supposed to be 21 ounces because they supposedly lose an ounce when cooked. Create a frequency distribution with 5 classes. Based on your distribution, comment on the advertised "20 ounce" steaks. 17 20 21 18 20 20 20 18 19 19 20 19 21 20 18 20 20 19 18 19
(Essay)
4.9/5 (29)
Use the data to create a stemplot.
-Twenty-four workers were surveyed about how long it takes them to travel to work each day. The data below are given in minutes.
20 35 42 52 65 20 60 49 24 37 23 24 22 20 41 25 28 27 50 47 58 30 32 48
(Multiple Choice)
4.9/5 (36)
The data shows the roundtrip mileage that 43 randomly selected students drive to school each day. Construct a frequency polygon. Applying a loose interpretation of the requirements for a normal distribution, do the mileages appear to be normally distributed? Why or why not? Miles Frequency 10-14 0 15-19 6 20-24 9 25-29 21 30-34 7
(Essay)
4.9/5 (33)
The following frequency distribution analyzes the scores on a math test. Find the class midpoint of scores interval 40-59.
Scores Number of students 40-59 2 60-75 4 76-82 6 83-94 15 95-99 5
(Multiple Choice)
4.9/5 (34)
300 casino patrons, were interviewed as they left the casino. 90 of them said they spent most of the time playing the slots. 90 of them said they played blackjack. 45 said they played craps. 15 said roulette. 15 said poker. The rest were not sure what they played the most. Construct a Pareto chart to depict the gaming practices of the group of casino goers. Choose the vertical scale so that the relative frequencies are represented.
(Multiple Choice)
4.8/5 (31)
The weights of 22 members of the varsity football team are listed below.
144 152 142 151 160 152 131 164 141 153 140 144 175 156 147 133 172 159 135 159 148 171
(Multiple Choice)
4.8/5 (27)
A television manufacturer sold three times as many televisions in 2005 as it did in 1995. To illustrate this fact, the manufacturer draws a graph as shown below. The television on the right is three times as tall and three times as wide as the television on the left. Why is this graph misleading? What visual impression is created by the graph? 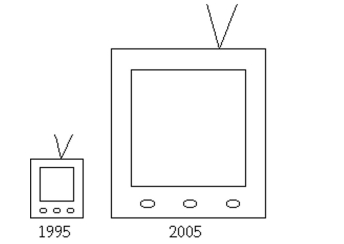
(Essay)
4.8/5 (32)
The following frequency distribution analyzes the scores on a math test. Find the class midpoint of scores interval 95-99.
Scores Number of students 40-59 2 60-75 4 76-82 6 83-94 15 95-99 5
(Multiple Choice)
4.9/5 (34)
Filters
- Essay(0)
- Multiple Choice(0)
- Short Answer(0)
- True False(0)
- Matching(0)