Exam 10: Correlation and Regression
Explain why having a significant linear correlation does not imply causality. Give an example to support your answer.
Two variables may have a high correlation without being causally related. They may be strongly correlated because they are both associated with other variables, called lurking variables, that cause changes in both variables under consideration.
For example, a study found a positive linear correlation between teachers' salaries and the dollar amount of liquor sales. This does not imply causation (it does not imply that increasing teachers' salaries would cause an increase in liquor sales). A possible explanation is that both variables are tied to other variables, such as the rate of inflation, that pull them along together. Examples will vary.
Given that the rank correlation coefficien for 15 pairs of data is -0.636, test the claim of correlation between the two variables. Use a significance level of 0.01.
. Critical values: .
Fail to reject the null hypothesis . There does not appear to be a correlation between the two variables.
Given the linear correlation coefficient r and the sample size n, determine the critical values of r and use your finding to state whether or not the given r represents a significant linear correlation. Use a significance level of 0.05.
-
A
Suppose you will perform a test to determine whether there is sufficient evidence to support a claim of a linear correlation between two variables. Find the critical values of r given the number of pairs of data n and the significance
level
-
Given: The linear correlation coefficient between scores on a math test and scores on a test of athletic ability is negative and close to zero.
Conclusion: People who score high on the math test tend to score lower on the test of athletic ability.
Find the critical value. Assume that the test is two-tailed and that n denotes the number of pairs of data.
-
Use the rank correlation coefficient to test for a correlation between the two variables.
-Ten luxury cars were ranked according to their comfort levels and their prices. Make Comfort Price A 1 B 8 7 C 9 3 D 10 5 E 4 4 F 3 2 G 2 10 H 1 9 I 7 6 6 8
Find the rank correlation coefficient and test the claim of correlation between comfort and price. Use a significance level of 0.05.
Define the terms predictor variable and response variable. Give examples for each.
Find the value of the linear correlation coefficient r.
-The paired data below consist of the costs of advertising (in thousands of dollars) and the number of products sold (in thousands): Cost 9 2 3 4 2 5 9 10 Number 85 52 55 68 67 86 83 73
Given the linear correlation coefficient r and the sample size n, determine the critical values of r and use your finding to state whether or not the given r represents a significant linear correlation. Use a significance level of 0.05.
-
Use the given data to find the equation of the regression line. Round the final values to three significant digits, if necessary.
- 1 3 5 7 9 143 116 100 98 90
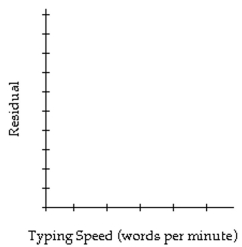
The sample data below are the typing speeds (in words per minute) and reading speeds (in words per minute) of nine randomly selected secretaries. Here, x denotes typing speed, and y denotes reading speed.
60 56 52 63 70 58 44 79 62 370 551 528 348 645 454 503 618 500
The regression equation was obtained. Construct a residual plot for the data.
Find the critical value. Assume that the test is two-tailed and that n denotes the number of pairs of data.
-
The following residual plot is obtained after a regression equation is determined for a set of data. Does the residual plot suggest that the regression equation is a bad model? Why or why not? 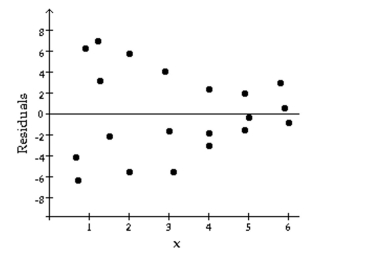
Define rank. Explain how to find the rank for data which repeats (for example, the data set:
4, 5, 5, 5, 7, 8, 12, 12, 15, 18).
A regression equation is obtained for the following set of data. For what range of x-values
would it be reasonable to use the regression equation to predict the y-value? Why? 2 4 6 9 10 12 28 33 39 45 47 52
The following table gives the US domestic oil production rates (excluding Alaska) over the past few years. A regression equation was fit to the data and the residual plot is shown below. Year Millions of barrels per day 1987 6.39 1988 6.12 1989 5.74 1990 5.58 1991 5.62 1992 5.46 1993 5.26 1994 5.10 Year Millions of barrels per day 1995 5.08 1996 5.07 1997 5.16 1998 5.08 1999 4.83 2000 4.85 2001 4.84 2002 4.83
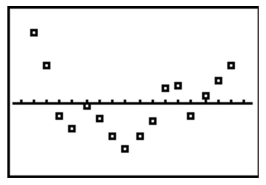 Does the residual plot suggest that the regression equation is a bad model? Why or why
not?
Does the residual plot suggest that the regression equation is a bad model? Why or why
not?
For each of 200 randomly selected cities, Pete recorded the number of churches in the city (x) and the number of homicides in the past decade (y). He calculated the linear correlation coefficient and was surprised to find a strong positive linear correlation for the two variables. Does this suggest that building new churches causes an increase in the number of homicides? Why do you think that a strong positive linear correlation coefficient was
obtained? Explain your answer with reference to the term lurking variable.
Given the linear correlation coefficient r and the sample size n, determine the critical values of r and use your finding to state whether or not the given r represents a significant linear correlation. Use a significance level of 0.05.
-
Determine which scatterplot shows the strongest linear correlation.
-Which shows the strongest linear correlation?
Filters
- Essay(0)
- Multiple Choice(0)
- Short Answer(0)
- True False(0)
- Matching(0)