Exam 3: Numerical Summaries of Center and Variation
Exam 1: Introduction to Data60 Questions
Exam 2: Picturing Variation With Graphs60 Questions
Exam 3: Numerical Summaries of Center and Variation60 Questions
Exam 4: Regression Analysis: Exploring Associations Between Variables58 Questions
Exam 5: Modeling Variation With Probability60 Questions
Exam 6: Modeling Random Events: the Normal and Binomial Models60 Questions
Exam 7: Survey Sampling and Inference60 Questions
Exam 8: Hypothesis Testing for Population Proportions60 Questions
Exam 9: Inferring Population Means60 Questions
Exam 10: Associations Between Categorical Variables59 Questions
Exam 11: Multiple Comparisons and Analysis of Variance60 Questions
Exam 12: Experimental Design: Controlling Variation60 Questions
Exam 13: Inference Without Normality60 Questions
Exam 14: Inference for Regression60 Questions
Select questions type
Use the following information to answer the question. Data and summary statistics about college professor's salaries was gathered from nine institutions and is presented below. This salary information is from professors teaching at the Master's level. Men Women 81907 77451 66290 64251 55632 54018 95724 91360 70034 68970 57179 56092 73648 69690 59052 57278 49751 48793
-According to a national study, the average salary for a professor teaching at the Master's level is approximately $70,000. How does the data from these nine institutions compare to this?
Does it appear that salaries for either group at these nine institutions agrees or disagrees with the study?
Free
(Essay)
4.7/5  (36)
(36)
Correct Answer: Verified
Although both groups from this sample have means that are below $70,000, they both have standard deviations that are relatively large so the sample agrees with study.
Eric is contemplating whether to accept a job offer in an unfamiliar city. The move would mean buying a new home for his family of five people. He is curious about typical home prices in the new city. Which information would more useful to him, average house prices or median house prices?
Explain.
Free
(Essay)
4.9/5 (36)
Correct Answer:Verified
Median house values would be more valuable since this is likely to be right-skewed data, which would pull the average up and would therefore not yield the true typical value.
Use the following information to answer the question. A junior high gym teacher recorded the time, in minutes, that it took two of her classes to run one mile. Here are the summary statistics for each class:
Class A:
-Write a sentence comparing the Class A and Class B. Does one class run faster than the other?
Explain.
Free
(Essay)
4.9/5 (47)
Correct Answer:Verified
Class B has a mean time that is slightly higher than Class A, but they also had a larger standard deviation so the two class may not be that different. We cannot say that one class is faster than the other, they are very similar.
Below is the standard deviation for extreme 10k finish times for a randomly selected group of women and men. Chose the statement that best summarizes the meaning of the standard deviation.
Women:
(Multiple Choice)
4.9/5 (40)
Use the following information to answer the question. In 2007, the average number of hours spent online at home for U. S. adults with internet access was 8.9 hours with a standard deviation of 0.4 hours. The U. S average was determined by collecting cluster data from thirty randomly selected states. Assume the distribution of time spent online at home is approximately unimodal and symmetric.
-The standard score for hours spent online at home for Minnesotans was 3.00. Approximately how many hours do Minnesotan adults spend online at home?
Show your work and round all calculations to the nearest tenth.
(Short Answer)
4.9/5 (29)
Use the side-by-side boxplots below to answer the question. The boxplots summarize the number of sentenced prisoners by state in the Midwest and West. 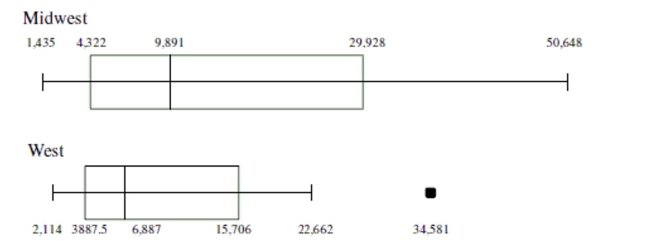 -Based on the boxplot for the Midwest, which of the following is true?
(Multiple Choice)
4.8/5 (33)
Use the following information to answer the question. The mean age of lead actors from the top ten grossing movies of 2007 was 36.4 years with a standard deviation of 9.87 years. Assume the distribution of the actors ages is approximately unimodal and symmetric.
-Between what two values would you expect to find about 68% of the lead actors ages?
(Multiple Choice)
4.8/5 (40)
Use the following information to answer the question. The mean age of lead actors from the top ten grossing movies of 2007 was 36.4 years with a standard deviation of 9.87 years. Assume the distribution of the actors ages is approximately unimodal and symmetric.
-Between what two values would you expect to find about 95% of the lead actors ages?
(Multiple Choice)
4.9/5 (35)
Use the side-by-side boxplots below to answer the question. The boxplots summarize the number of sentenced prisoners by state in the Midwest and West.  -Using the boxplot for the Midwest, determine which of the following statements about the distribution cannot be justified.
(Multiple Choice)
4.9/5 (47)
Use the following information to answer the question. The economic impact of an industry, such as sport fishing, can be measured by the retail sales it generates. In 2006, the economic impact of great lakes fishing in states bordering the great lakes had a mean of $318 and a standard deviation of $83.5. Note that all dollar amounts are in millions of dollars. Assume
the distribution of retail sales is unimodal and symmetric. (Source: National Oceanic and Atmospheric Administration).
-If a new report came out saying that the economic impact of great lakes sport fishing on the economy of Illinois was $93,588,546, would you say this was unusual? Note that this dollar amount Must be converted before calculating a standard score.
(Multiple Choice)
4.9/5 (42)
Calculate the five-number summary for the following dataset. 51 53 62 34 36 39 43 63 73 79
(Multiple Choice)
4.7/5 (40)
Use the following information to answer the question. Here is a table recording the number of deaths for the top thirteen
worst U.S. tornados since 1925. A histogram showing the distribution is also included. 689 268 454 150 102 181 208 114 142 115 271 110 315
 -Choose the most appropriate measure of center then calculate the typical value rounded to the nearest tenth.
(Multiple Choice)
4.8/5 (31)
The following nine values represent race finish times in hours for a randomly selected group of participants in an extreme 10k race (a 10k race with obstacles). Which of the following is closest to the mean of the following data set?
1.0, 1.2, 1.2, 1.3, 1.4, 1.5, 1.5, 1.7, 2.1
(Multiple Choice)
4.7/5 (39)
Use the following information to answer the question. The economic impact of an industry, such as sport fishing, can be measured by the retail sales it generates. In 2006, the economic impact of great lakes fishing in states bordering the great lakes had a mean of $318 and a standard deviation of $83.5. Note that all dollar amounts are in millions of dollars. Assume
the distribution of retail sales is unimodal and symmetric. (Source: National Oceanic and Atmospheric Administration).
-For what percentage of great lakes states would you expect the economic impact from fishing to be between $151.00 and $485.00 (in millions of dollars)?
(Multiple Choice)
4.9/5 (30)
The following nine values represent race finish times in hours for a randomly selected group of participants in an extreme 10k race (a 10k race with obstacles). Which of the following is closest to The mean of the following data set?
1.0, 1.1, 1.2, 1.2, 1.3, 1.4, 1.4, 1.4, 1.5
(Multiple Choice)
4.9/5 (28)
Use the following information for the question. The boxplots below are from a Graphing Calulator. The boxplots summarize the cost in dollars of a typical evening out for two people (dinner and a movie) in two different cities in west Michigan, Muskegon (top boxplot) and Grand Rapids (bottom boxplot). The five-number summaries are also given for each city. 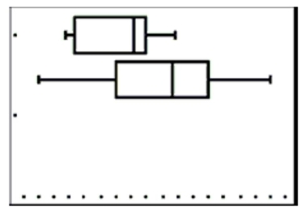 Muskegon: 59,62,80.5,85,94
Grand Rapids: 50,75,93.5,105,125
-Explain which city you think is more economical for an evening out and why. Be sure to comment on differences in typical value and variation for each city.
Muskegon: 59,62,80.5,85,94
Grand Rapids: 50,75,93.5,105,125
-Explain which city you think is more economical for an evening out and why. Be sure to comment on differences in typical value and variation for each city.
(Essay)
4.9/5 (37)
The U.S. Supreme Court Chief Justice data was used to create the following output in an Excel spreadsheet. Choose the statement that best summarizes the variability of the dataset. Column1 Standard Error 1.864217971 Standard Deviation 5.592653912 Sample Variance 31.27777778 Kurtosis 1.177934931 Skewness -1.064306225 Range 18 Minimum 50 Maximum 68 Sum 553 Count 9
(Multiple Choice)
4.8/5 (41)
Use the following information to answer the question. Data and summary statistics about college professor's salaries was gathered from nine institutions and is presented below. This salary information is from professors teaching at the Master's level. Men Women 81907 77451 66290 64251 55632 54018 95724 91360 70034 68970 57179 56092 73648 69690 59052 57278 49751 48793
-Suppose a female professor is offered a position with an annual salary of $80,000. Compared to the women from the nine institutions in the study, would this be an unusually good salary?
Explain.
(Essay)
4.9/5 (33)
Use the following information to answer the question. The mean age of lead actresses from the top ten grossing movies of 2010 was 29.6 years with a standard deviation of 6.35 years. Assume the distribution of the actresses' ages is approximately unimodal and symmetric.
-In 2010, popular actress Jennifer Aniston was 41-years-old. What is Jennifer Aniston's age if it is standardized? Would it be unusual for a 41-year-old actress to be in a top-grossing film of 2010? Assume the Empirical Rule applies and round to the nearest hundredth.
(Multiple Choice)
4.8/5 (38)
Use the following information to answer the question. The mean age of lead actors from the top ten grossing movies of 2007 was 36.4 years with a standard deviation of 9.87 years. Assume the distribution of the actors ages is approximately unimodal and symmetric.
-Calculate the five-number summary for the following dataset. 41.19, 83.51, 19.98, 114.60, 63.08, 83.88
(Multiple Choice)
4.9/5 (35)
Filters
- Essay(0)
- Multiple Choice(0)
- Short Answer(0)
- True False(0)
- Matching(0)