Exam 14: Inference for Regression
Exam 1: Introduction to Data60 Questions
Exam 2: Picturing Variation With Graphs60 Questions
Exam 3: Numerical Summaries of Center and Variation60 Questions
Exam 4: Regression Analysis: Exploring Associations Between Variables58 Questions
Exam 5: Modeling Variation With Probability60 Questions
Exam 6: Modeling Random Events: the Normal and Binomial Models60 Questions
Exam 7: Survey Sampling and Inference60 Questions
Exam 8: Hypothesis Testing for Population Proportions60 Questions
Exam 9: Inferring Population Means60 Questions
Exam 10: Associations Between Categorical Variables59 Questions
Exam 11: Multiple Comparisons and Analysis of Variance60 Questions
Exam 12: Experimental Design: Controlling Variation60 Questions
Exam 13: Inference Without Normality60 Questions
Exam 14: Inference for Regression60 Questions
Select questions type
Which of the following statements is not true about the constant standard deviation condition of the linear regression model?
Free
(Multiple Choice)
4.8/5  (27)
(27)
Correct Answer: Verified
B
Which of the following statements is true about prediction intervals?
Free
(Multiple Choice)
4.8/5 (43)
Correct Answer:Verified
D
Which of the following statements is not true about the constant standard deviation condition of the linear regression model?
Free
(Multiple Choice)
4.8/5 (34)
Correct Answer:Verified
D
Use the following information to answer the question. A random sample of 30 married couples were asked to report the
height of their spouse and the height of their biological parent of the same gender as their spouse. The output of a regression
analysis for predicting spouse height from parent height is shown. Assume that the conditions of the linear regression model
are satisfied. Regression Analysis: Spouse versus Parent The regression equation is spouse =48.40+0.25 parent Predictor: Constant Predictor: Parent Parameter Estimate: 48.398 Parameter Estimate: 0.247 Standard Error: 39.695 Standard Error: 0.566 T-statistic: 1.219 T-statistic: 0.437 p-value: 0.277 p-value: 0.680 =7.794899045-=0.036858791=0.1919864344
-What is the slope of the regression line? Choose the statement that is the correct interpretation of the slope in context.
(Multiple Choice)
4.8/5 (35)
State the two conditions that must be satisfied, without exception, to make inferences using a linear model.
(Essay)
4.9/5 (37)
Use the following information to answer the question. Below is the scatterplot showing the association between raw material (in tons) put into an injection molding machine each day , and the amount of scrap plastic (in tons) that is collected from the machine every 4 weeks . The residual plot of the data is also shown along with a QQ plot of the residuals.
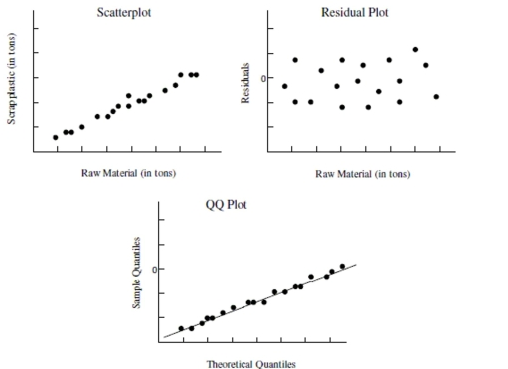 -Choose the statement that is true about the estimators for slope and intercept of a regression line when the conditions of the linear model hold.
(Multiple Choice)
4.9/5 (37)
The regression output below is the result of testing whether there is an association between the number of practice test problems a student completed and the number of questions answered
Correctly on the test. Assume that the conditions of the linear regression model are satisfied. What
Is the 95% confidence interval for the intercept (rounded to the nearest hundredth)? Does this
Interval support the theory that the intercept is zero? Choose the statement that summarizes your
Answer in context. Coefficients Standard Error Lower 95\% Upper 95\% Intercept -2.12319885 2.3432 -8.14673883 3.90034114 Slope 1.108789625 0.0977 0.85765303 1.359926221
(Multiple Choice)
4.8/5 (38)
Use the following information to answer the question. Below is the scatterplot showing the association between the number of workers on an assembly team (x), and the number of parts assembled in an 8-hour shift (y). The residual plot of the data is also shown along with a QQ plot of the residuals. 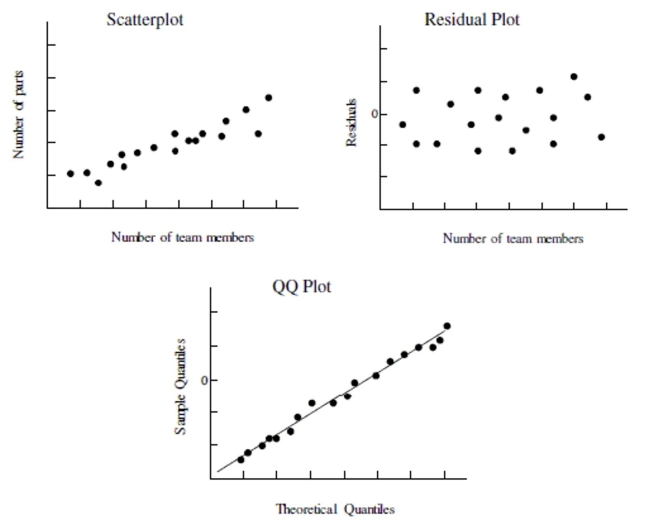 -Use the plot(s) above to explain whether the condition for constant standard deviation is satisfied.
(Essay)
4.9/5 (37)
Use the following information to answer the question. The pulse rate of a random sample of 30 second graders was recorded before and after a fifteen minute recess. The output of a regression analysis for predicting pulse rate after recess from pulse rate before recess is shown. Assume that the conditions of the linear regression model are satisfied. Regression Analysis: Pulse before recess versus Pulse after recess The regression equation is pulse before =14.62+0.92 pulse after Predictor: Constant Predictor: Pulse before Parameter Estimate: 14.6190 Parameter Estimate: 0.9167 Standard Error: 8.536 Standard Error: 0.111 T-statistic: 1.713 T-statistic: 8.26 p-value: 0.147 p-value: 0.000 S=7.794899045 R-sq=0.036858791 r=0.1919864344
-If the intercept was 0 and the slope was 1, explain how the linear model would be interpreted in context.
(Essay)
4.8/5 (31)
The regression output below is the result of testing whether there is an association between the number of hours of sleep a student had the night before an exam and the number of questions
Answered correctly on the exam. Assume that the conditions of the linear regression model are
Satisfied. What is the 95% confidence interval for the intercept (rounded to the nearest hundredth)?
Does this interval support the theory that the intercept is zero? Choose the statement that
Summarizes your answer in context. Coefficients Standard Error Lower 95\% Upper 95\% Intercept -0.25 1.85713484 -4.64144652 4.14144652 Slope 0.087621024 0.023022636 0.033181139 0.142060908
(Multiple Choice)
4.9/5 (35)
Suppose that you were presented with data showing the association between days absent from class and final class average. Which of the following residual plots below suggests that the
Association between number of days absent from class and final class average is linear?
(Multiple Choice)
4.9/5 (36)
Use the following information to answer the question. A statistics professor is interested in learning whether there is a
positive association between number of posts by online students on a message board and the final class average in an online
statistics course. The computer output below shows the results from a regression model in which the final class average was
predicted by the number of message board posts. Assume that the conditions of the linear regression model are satisfied. LinRegTTest for y=a+bx \beta>0 a=69.7104476 t=3.707824045 b=.8144278607 p=0.0024306618 s=5.14275481 df=119 r=.7774060152
-Choose the correct observed value of the test statistic and the p-value. Round to the nearest thousandth.
(Multiple Choice)
4.8/5 (39)
Use the following information to answer the question. A high school boys track and field coach performs a regression to predict the vault height (in feet) of a pole vault from the number of minutes of training in the previous week. The output is shown below. Assume that the conditions of the linear regression model hold. Regression Analysis: Training versus vault height
The regression equation is vault height training minutes
Predicted Values:
value Pred. Y s.e. (Pred. y) 95\% C.I. 95\% P.I. 175 15.375 1.24113 (12.275,18.475) (10.875,19.875)
-Suppose the coach's top pole vaulter trained for 175 minutes the previous week. If this athlete participates in the pole vault event, what is the coach's expected jump height for this athlete?
Can he be reasonably confident that this athlete will beat the previous season's record of 19.8 feet?
Explain.
(Essay)
4.8/5 (37)
Use the following information to answer the question. An engineer is interested in learning whether there is an association between temperature (°F) and the strength of an automotive plastic cup holder which is measured by finding the pounds per square inch (psi) it takes to break the cup holder. The computer output below shows the results from a regression model in which the breaking point in psi was predicted by the temperature. Assume that the conditions of the linear regression model are satisfied. LinRegTTest for y=a+bx \beta>0 a=10.06846186 t=5.9838909 b=.2252509467 p=9.3423882E-4 s=2.595293293 df=119 r=.9367346759
-State the decision regarding the null hypothesis and the correct conclusion. State your conclusion using a significance level of 5%.
(Essay)
4.8/5 (34)
Test the hypothesis that the slope is zero (significance level is 0.05), then state the correct decision regarding the null hypothesis and write a statement that correctly summarizes the conclusion in context.
(Essay)
4.8/5 (37)
Which of the following is not true about the coefficient of determination, ?
(Multiple Choice)
4.9/5 (36)
Explain what residuals are. Where do residuals come from?
How are residuals calculated?
Complete the table below by calculating the residuals for the following small data set. The linear model relating and is . x y Residual 11 -100 5 -51 7 -63 4 -34
(Essay)
4.9/5 (41)
Use the following information to answer the question. A high school boys track and field coach performs a regression to predict the vault height (in feet) of a pole vault from the number of minutes of training in the previous week. The output is shown below. Assume that the conditions of the linear regression model hold. Regression Analysis: Training versus vault height
The regression equation is vault height training minutes
Predicted Values:
X value Pred. Y s.e. (Pred. y) 95\% C.I. 95\% P.I. 175 15.375 1.24113 (12.275,18.475) (10.875,19.875)
-The coach wants to project what the jump height of his top pole vaulter will be who trained for 175 minutes the previous week. Should the coach use a confidence interval or a prediction interval?
(Short Answer)
4.8/5 (30)
Which of the following is not true about residuals? If all the statements are true choose (d).
(Multiple Choice)
4.8/5 (31)
Use the following information to answer the question. A random sample of 30 married couples were asked to report the
height of their spouse and the height of their biological parent of the same gender as their spouse. The output of a regression
analysis for predicting spouse height from parent height is shown. Assume that the conditions of the linear regression model
are satisfied. Regression Analysis: Spouse versus Parent The regression equation is spouse =48.40+0.25 parent Predictor: Constant Predictor: Parent Parameter Estimate: 48.398 Parameter Estimate: 0.247 Standard Error: 39.695 Standard Error: 0.566 T-statistic: 1.219 T-statistic: 0.437 p-value: 0.277 p-value: 0.680 S=7.794899045 R-sq =0.036858791=0.1919864344
-Test the hypothesis that the slope is zero (significance level is 0.05), then choose the correct decision regarding the null hypothesis and the statement that correctly summarizes the conclusion.
(Multiple Choice)
4.9/5 (40)
Filters
- Essay(0)
- Multiple Choice(0)
- Short Answer(0)
- True False(0)
- Matching(0)