Exam 3: Numerical Summaries of Center and Variation
Exam 1: Introduction to Data60 Questions
Exam 2: Picturing Variation With Graphs60 Questions
Exam 3: Numerical Summaries of Center and Variation60 Questions
Exam 4: Regression Analysis: Exploring Associations Between Variables58 Questions
Exam 5: Modeling Variation With Probability60 Questions
Exam 6: Modeling Random Events: the Normal and Binomial Models60 Questions
Exam 7: Survey Sampling and Inference60 Questions
Exam 8: Hypothesis Testing for Population Proportions60 Questions
Exam 9: Inferring Population Means60 Questions
Exam 10: Associations Between Categorical Variables59 Questions
Exam 11: Multiple Comparisons and Analysis of Variance60 Questions
Exam 12: Experimental Design: Controlling Variation60 Questions
Exam 13: Inference Without Normality60 Questions
Exam 14: Inference for Regression60 Questions
Select questions type
Use the following information to answer the question. Data and summary statistics about college professor's salaries was gathered from nine institutions and is presented below. This salary information is from professors teaching at the Master's level. Men Women 81907 77451 66290 64251 55632 54018 95724 91360 70034 68970 57179 56092 73648 69690 59052 57278 49751 48793
-Which group has more variability?
How would this affect the histogram for the group, compared to the other group?
Explain.
(Essay)
4.9/5  (37)
(37)
Use the following data to answer the question. Here are the scores on a recent statistics midterm exam (Scores have been listed from lowest to highest). A histogram showing the distribution is also included. 3 11 11 12 13 14 15 15 18 18 19 19 19 20 20 20 21 21 22 22 22 23 23 24 24
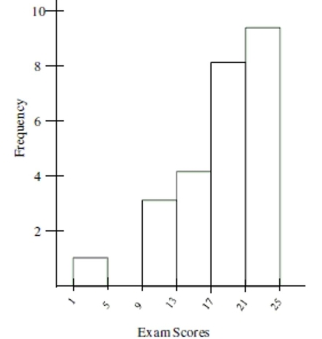 -Choose the most appropriate measure of variability for the data and calculate it. Explain why you chose the measure of variability that you did. Round all calculations to the nearest tenth if necessary.
(Essay)
4.8/5 (40)
Use the following data to answer the question. Here are the scores on a recent statistics midterm exam (Scores have been listed from lowest to highest). A histogram showing the distribution is also included. 3 11 11 12 13 14 15 15 18 18 19 19 19 20 20 20 21 21 22 22 22 23 23 24 24
-Which measure of center, mean or median, would be most appropriate, and why?
Using the data and the histogram, find the approximate value of the appropriate measure of center, and describe how you found it.
(Essay)
4.9/5 (47)
Use the following information to answer the question. The economic impact of an industry, such as sport fishing, can be measured by the retail sales it generates. In 2006, the economic impact of great lakes fishing in states bordering the great lakes had a mean of $318 and a standard deviation of $83.5. Note that all dollar amounts are in millions of dollars. Assume
the distribution of retail sales is unimodal and symmetric. (Source: National Oceanic and Atmospheric Administration).
-If a new report came out saying that the economic impact of great lakes sport fishing on the economy of Illinois was $93,588,546, would you say this was unusual? Note that this dollar amount Must be converted before calculating a standard score.
(Multiple Choice)
4.8/5 (31)
Use the following information to answer the question. The mean age of lead actresses from the top ten grossing movies of 2010 was 29.6 years with a standard deviation of 6.35 years. Assume the distribution of the actresses' ages is approximately unimodal and symmetric.
-A city planner says, "The typical commute to work for someone living in the city limits is less than the commute to work for someone living in the suburbs." What does this statement mean?
(Multiple Choice)
4.8/5 (48)
The following list shows the age at appointment of U.S. Supreme Court Chief Justices appointed since 1900. Use the data to
answer the question. Last Name Age White 65 Taft 63 Hughes 67 Stone 68 Vinson 56 Last Name Age Warren 62 Burger 61 Rehnquist 61 Roberts 50
-Find the mean, rounding to the nearest tenth of a year, and interpret the mean in this context.
(Multiple Choice)
4.9/5 (34)
Use the following information to answer the question. The mean age of lead actresses from the top ten grossing movies of 2010 was 29.6 years with a standard deviation of 6.35 years. Assume the distribution of the actresses' ages is approximately unimodal and symmetric.
-Between what two values would you expect to find about 95% of the lead actresses ages?
(Multiple Choice)
4.8/5 (41)
The following list shows the age at appointment of U.S. Supreme Court Chief Justices appointed since 1900. Use the data to answer the question. Last Name Age White 65 Taft 63 Hughes 67 Stone 68 Vinson 56 Last Name Age Warren 62 Burger 61 Rehnquist 61 Roberts 50
-The U.S. Supreme Court Chief Justice data was used to create the following output in an Excel spreadsheet. Choose the statement that best summarizes the variability of the dataset. Column1 Standard Error 1.864217971 Standard Deviation 5.592653912 Sample Variance 31.27777778 Kurtosis 1.177934931 Skewness -1.064306225 Range 18 Minimum 50 Maximum 68 Sum 553 Count 9
(Multiple Choice)
4.9/5 (35)
Use the following information to answer the question. The average snowfall for cities in Michigan is 71.6 inches with a standard deviation of 9.7 inches. Assume the distribution for annual snowfall is approximately unimodal and symmetrical.
-What is the range of values for annual snowfall that would contain roughly 95% of the cities in Michigan?
Round calculations to the nearest tenth.
(Short Answer)
4.9/5 (40)
Use the following information to answer the question. The mean age of lead actors from the top ten grossing movies of 2007 was 36.4 years with a standard deviation of 9.87 years. Assume the distribution of the actors ages is approximately unimodal and symmetric.
-In 2002, actor Adrian Brody won an academy award in for the movie "The Pianist." He was 29-years-old. Finish the statement: "According to the Empirical Rule, the ages of nearly all lead Actors will be between and years. Adrien Brody was this Range when she won the academy award."
(Multiple Choice)
4.8/5 (36)
Use the side-by-side boxplots below to answer the question. The boxplots summarize the number of sentenced prisoners by state in the Midwest and West.  -Pick the statement that best describes the shape of the distribution for the states in the West.
(Multiple Choice)
4.7/5 (34)
Use the side-by-side boxplots below to answer the question. The boxplots summarize the number of sentenced prisoners by
state in the Midwest and West.  -Using the boxplot for the West, determine which of the following statements about the distribution cannot be justified.
(Multiple Choice)
4.8/5 (39)
Use the following information to answer the question. The mean age of lead actresses from the top ten grossing movies of 2010 was 29.6 years with a standard deviation of 6.35 years. Assume the distribution of the actresses' ages is approximately unimodal and symmetric.
-In 1993, actress Anna Paquin won an academy award in for the movie "The Piano." She was 11-years-old. Finish the statement: "According to the Empirical Rule, the ages of nearly all lead Actresses will be between and years. Anna Paquin was this Range when she won the academy award."
(Multiple Choice)
4.9/5 (38)
Use the following information to answer the question. The economic impact of an industry, such as sport fishing, can be measured by the retail sales it generates. In 2006, the economic impact of great lakes fishing in states bordering the great lakes had a mean of $318 and a standard deviation of $83.5. Note that all dollar amounts are in millions of dollars. Assume
the distribution of retail sales is unimodal and symmetric. (Source: National Oceanic and Atmospheric Administration).
-For what percentage of great lakes states would you expect the economic impact from fishing to be between $234.5 and $401.5 (in millions of dollars)?
(Multiple Choice)
4.7/5 (36)
Use the following information to answer the question. The economic impact of an industry, such as sport fishing, can be measured by the retail sales it generates. In 2006, the economic impact of great lakes fishing in states bordering the great lakes had a mean of $318 and a standard deviation of $83.5. Note that all dollar amounts are in millions of dollars. Assume
the distribution of retail sales is unimodal and symmetric. (Source: National Oceanic and Atmospheric Administration).
-The economic impact of fishing for nearly all great lakes states should fall within what range (in millions of dollars)?
(Multiple Choice)
4.7/5 (25)
Use the following information to answer the question. Here is a table recording the number of deaths for the top thirteen worst U.S. tornados since 1925. A histogram showing the distribution is also included. 689 268 454 150 102 181 208 114 142 115 271 110 315
 -Estimate the most appropriate measure of variability.
(Multiple Choice)
4.7/5 (30)
Use the following information to answer the question. The mean age of lead actors from the top ten grossing movies of 2007 was 36.4 years with a standard deviation of 9.87 years. Assume the distribution of the actors ages is approximately unimodal and symmetric.
-In 2007, popular actor and singer Justin Timberlake was 26-years-old. What is Justin Timberlake's age in 2007 if it is standardized? Would it be unusual for a 26-year-old actor to be in a Top-grossing film of 2007? Assume the Empirical Rule applies and round to the nearest hundredth.
(Multiple Choice)
4.9/5 (38)
Use the following information to answer the question. In 2007, the average number of hours spent online at home for U. S. adults with internet access was 8.9 hours with a standard deviation of 0.4 hours. The U. S average was determined by collecting cluster data from thirty randomly selected states. Assume the distribution of time spent online at home is approximately unimodal and symmetric.
-What is the range of time spent online at home for 95% of adults with internet access?
Round to the nearest tenth.
(Short Answer)
4.8/5 (36)
In your own words, explain what the Empirical Rule says and what conditions an distribution must meet in order to apply the rule.
(Essay)
4.8/5 (37)
The mean price of a pound of ground beef in 75 cities in the Midwest is $2.11 and the standard deviation is $0.56. A histogram of the data shows that the distribution is symmetrical. A local Midwest grocer is selling a pound of ground beef for $3.25. What is this price in standard units?
Assuming the Empirical Rule applies, would this price be unusual or not? Round to the nearest Hundredth.
(Multiple Choice)
4.9/5 (32)
Filters
- Essay(0)
- Multiple Choice(0)
- Short Answer(0)
- True False(0)
- Matching(0)