Exam 3: Numerical Summaries of Center and Variation
Exam 1: Introduction to Data60 Questions
Exam 2: Picturing Variation With Graphs60 Questions
Exam 3: Numerical Summaries of Center and Variation60 Questions
Exam 4: Regression Analysis: Exploring Associations Between Variables58 Questions
Exam 5: Modeling Variation With Probability60 Questions
Exam 6: Modeling Random Events: the Normal and Binomial Models60 Questions
Exam 7: Survey Sampling and Inference60 Questions
Exam 8: Hypothesis Testing for Population Proportions60 Questions
Exam 9: Inferring Population Means60 Questions
Exam 10: Associations Between Categorical Variables59 Questions
Exam 11: Multiple Comparisons and Analysis of Variance60 Questions
Exam 12: Experimental Design: Controlling Variation60 Questions
Exam 13: Inference Without Normality60 Questions
Exam 14: Inference for Regression60 Questions
Select questions type
Use the side-by-side boxplots below to answer the question. The boxplots summarize the number of sentenced prisoners by state in the Midwest and West. 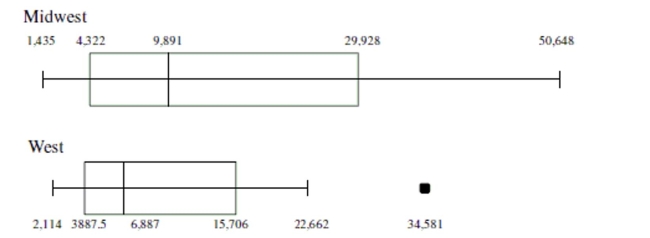 -Based on the boxplot for the West, which of the following is true?
(Multiple Choice)
4.8/5  (38)
(38)
Use the following information to answer the question. A junior high gym teacher recorded the time, in minutes, that it took two of her classes to run one mile. Here are the summary statistics for each class:
Class A:
-Calculate the sample variance for each class. Round to the nearest hundredth and be sure to use the correct symbols and units.
(Essay)
4.9/5 (41)
Use the following data to answer the question. Here are the scores on a recent statistics midterm exam (Scores have been listed from lowest to highest). A histogram showing the distribution is also included. 3 11 11 12 13 14 15 15 18 18 19 19 19 20 20 20 21 21 22 22 22 23 23 24 24
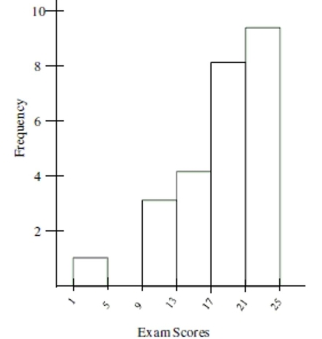 -The worst midterm grade was received by a student who was absent the week prior to the exam due to illness. Should this grade be considered an outlier?
Explain and support your reasoning. Be sure to state what you would do with this data value.
-The worst midterm grade was received by a student who was absent the week prior to the exam due to illness. Should this grade be considered an outlier?
Explain and support your reasoning. Be sure to state what you would do with this data value.
(Essay)
4.9/5 (34)
Use the following information to answer the question. The mean age of lead actresses from the top ten grossing movies of 2010 was 29.6 years with a standard deviation of 6.35 years. Assume the distribution of the actresses' ages is approximately unimodal and symmetric.
-Between what two values would you expect to find about 68% of the lead actresses ages?
(Multiple Choice)
5.0/5 (38)
Explain in your own words what the sample standard deviation is and why it is an important summary statistic.
(Essay)
4.8/5 (33)
Use the following information to answer the question. Here is a table recording the number of deaths for the top thirteen worst U.S. tornados since 1925. A histogram showing the distribution is also included. 689 268 454 150 102 181 208 114 142 115 271 110 315
 -The worst tornado on record since 1925 is a tornado that went through Missouri, Illinois, and Indiana on March 18, 1925. It killed 689 people. Suppose that when this value was entered into a
Calculator or other software a mistake was made and it was entered as 1,689. Choose the statement That describes what affect this mistake will have on the mean and median.
-The worst tornado on record since 1925 is a tornado that went through Missouri, Illinois, and Indiana on March 18, 1925. It killed 689 people. Suppose that when this value was entered into a
Calculator or other software a mistake was made and it was entered as 1,689. Choose the statement That describes what affect this mistake will have on the mean and median.
(Multiple Choice)
4.8/5 (33)
Use the following information to answer the question. The economic impact of an industry, such as sport fishing, can be measured by the retail sales it generates. In 2006, the economic impact of great lakes fishing in states bordering the great lakes had a mean of $318 and a standard deviation of $83.5. Note that all dollar amounts are in millions of dollars. Assume
the distribution of retail sales is unimodal and symmetric. (Source: National Oceanic and Atmospheric Administration).
-The economic impact of fishing for nearly all great lakes states should fall within what range (in millions of dollars)?
(Multiple Choice)
4.9/5 (39)
Use the following information to answer the question. The average snowfall for cities in Michigan is 71.6 inches with a standard deviation of 9.7 inches. Assume the distribution for annual snowfall is approximately unimodal and symmetrical.
-In 2007, the annual snowfall in Grand Rapids, Michigan was 97.2 inches. What is the standard score for the 2007 snowfall?
Was this an unusual amount of snowfall for a city in Michigan?
Show all work and round any calculations to the nearest tenth.
(Essay)
4.8/5 (42)
Choose the most appropriate measure of center then calculate the typical value rounded to the nearest tenth.
(Multiple Choice)
4.8/5 (47)
Use the following information to answer the question. Here is a table recording the number of deaths for the top thirteen
worst U.S. tornados since 1925. A histogram showing the distribution is also included. 689 268 454 150 102 181 208 114 142 115 271 110 315
-The worst tornado on record since 1925 is a tornado that went through Missouri, Illinois, and Indiana on March 18, 1925. It killed 689 people. Suppose that when this value was entered into a Calculator or other software a mistake was made and it was entered as 1,689. Choose the statement
That describes what affect this mistake will have on the median and the mean.
(Multiple Choice)
4.8/5 (33)
Use the following information to answer the question. The average snowfall for cities in Michigan is 71.6 inches with a standard deviation of 9.7 inches. Assume the distribution for annual snowfall is approximately unimodal and symmetrical.
-What is the range of values for annual snowfall that would contain roughly 68% of the cities in Michigan?
Round calculations to the nearest tenth.
(Short Answer)
5.0/5 (44)
Use the following information to answer the question. Here is a table recording the number of deaths for the top thirteen worst U.S. tornados since 1925. A histogram showing the distribution is also included. 689 268 454 150 102 181 208 114 142 115 271 110 315
 -Estimate the most appropriate measure of variability.
(Multiple Choice)
4.8/5 (27)
Use the side-by-side boxplots below to answer the question. The boxplots summarize the number of sentenced prisoners by
state in the Midwest and West.  -Pick the statement that best describes the shape of the distribution for the states in the Midwest.
(Multiple Choice)
4.7/5 (48)
The following list shows the age at appointment of U.S. Supreme Court Chief Justices appointed since 1900. Use the data to answer the question. Last Name Age White 65 Taft 63 Hughes 67 Stone 68 Vinson 56 Last Name Age Warren 62 Burger 61 Rehnquist 61 Roberts 50
-Below is the standard deviation for extreme 10k finish times for a randomly selected group of women and men. Chose the statement that best summarizes the meaning of the standard deviation.
Women:
(Multiple Choice)
4.9/5 (42)
In 2007, the mean price per pound of lobster in New England was $11.48 and the standard deviation was $2.12. A histogram of the data shows that the distribution is symmetrical. A local New England grocer is selling lobster for $8.99 per pound. What is this price in standard units? Assuming the Empirical Rule applies, would this price be considered unusual or not? Round to the
Nearest hundredth.
(Multiple Choice)
4.9/5 (41)
The following list shows the age at appointment of U.S. Supreme Court Chief Justices appointed since 1900. Use the data to answer the question. Last Name Age White 65 Taft 63 Hughes 67 Stone 68 Vinson 56 Last Name Age Warren 62 Burger 61 Rehnquist 61 Roberts 50
-Find the mean, rounding to the nearest tenth of a year, and interpret the mean in this context.
(Multiple Choice)
4.9/5 (42)
Use the following information for the question. The boxplots below are from a Graphing Calulator. The boxplots summarize the cost in dollars of a typical evening out for two people (dinner and a movie) in two different cities in west Michigan, Muskegon (top boxplot) and Grand Rapids (bottom boxplot). The five-number summaries are also given for each city. 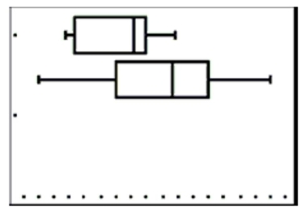 Muskegon: 59,62,80.5,85,94
Grand Rapids: 50,75,93.5,105,125
-Brian and his significant other plan to visit west Michigan and eat out every night at a different restaurant. He wants to be careful about his budget. Based on the information provided, which city would be best for them to visit and why?
Muskegon: 59,62,80.5,85,94
Grand Rapids: 50,75,93.5,105,125
-Brian and his significant other plan to visit west Michigan and eat out every night at a different restaurant. He wants to be careful about his budget. Based on the information provided, which city would be best for them to visit and why?
(Essay)
4.9/5 (39)
The average grade on an algebra exam was 76% with a standard deviation of 6 percentage points. The average grade on a chemistry exam was 81% with a standard deviation of 2 percentage points. Julie got a grade of 83% on both exams. Which exam did she do relatively better on?
Show all work and round any calculations to the nearest hundredth.
(Essay)
4.8/5 (38)
Use the following information to answer the question. The economic impact of an industry, such as sport fishing, can be measured by the retail sales it generates. In 2006, the economic impact of great lakes fishing in states bordering the great lakes had a mean of $318 and a standard deviation of $83.5. Note that all dollar amounts are in millions of dollars. Assume
the distribution of retail sales is unimodal and symmetric. (Source: National Oceanic and Atmospheric Administration).
-A school board member says, "The typical bus ride to school for a student living in the city limits is more than the bus ride to school for a student living in the suburbs." What does this statement mean?
(Multiple Choice)
4.8/5 (38)
Use the following information to answer the question. In 2007, the average number of hours spent online at home for U. S. adults with internet access was 8.9 hours with a standard deviation of 0.4 hours. The U. S average was determined by collecting cluster data from thirty randomly selected states. Assume the distribution of time spent online at home is approximately unimodal and symmetric.
-If a new report came out saying that on average, Floridian adults spent 8.0 hours online while at home, would you say this was an unusual value?
If it was unusual, explain how you reached your conclusion and whether it was unusually high or low.
(Essay)
4.8/5 (37)
Filters
- Essay(0)
- Multiple Choice(0)
- Short Answer(0)
- True False(0)
- Matching(0)