Exam 13: Inference Without Normality
Exam 1: Introduction to Data60 Questions
Exam 2: Picturing Variation With Graphs60 Questions
Exam 3: Numerical Summaries of Center and Variation60 Questions
Exam 4: Regression Analysis: Exploring Associations Between Variables58 Questions
Exam 5: Modeling Variation With Probability60 Questions
Exam 6: Modeling Random Events: the Normal and Binomial Models60 Questions
Exam 7: Survey Sampling and Inference60 Questions
Exam 8: Hypothesis Testing for Population Proportions60 Questions
Exam 9: Inferring Population Means60 Questions
Exam 10: Associations Between Categorical Variables59 Questions
Exam 11: Multiple Comparisons and Analysis of Variance60 Questions
Exam 12: Experimental Design: Controlling Variation60 Questions
Exam 13: Inference Without Normality60 Questions
Exam 14: Inference for Regression60 Questions
Select questions type
Use the following information to answer the question. Math self-efficacy can be defined as one's belief in his or her own ability to perform mathematical tasks. A college math professor wishes to find out if her male students' math self-efficacy matches reality. To do this she gives a math quiz to the male students then asks them to rate their level of confidence in how well they did on the quiz. She plans to test whether those who had little confidence that they did well on the quiz actually performed worse than those who had a high level of confidence that they did well on the quiz. Shown below is the approximate sampling distribution of the difference in mean quiz scores. The table below shows the summary statistics for the two groups. Assume that all conditions for a randomization test have been satisfied. Group Mean Median Standard Deviation IQR High Conf. 105 82.5 84.0 7.1 12.5 Low Conf. 201 72.1 69.9 6.2 10.4 Test Stat: Mean High Conf. - Mean Low Conf. Number of simulations: 350
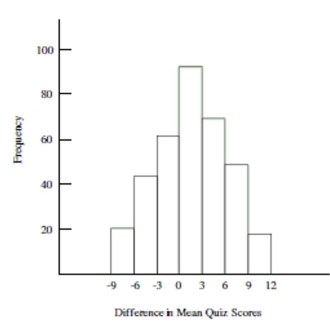 -Explain how you would use the histogram to get an approximate p-value and state your p-value estimation.
Free
(Essay)
4.7/5  (36)
(36)
Correct Answer: Verified
To approximate the p-value using the histogram draw a vertical line at about 14.1 then approximate the proportion of observations to the right of the vertical line. From the histogram it appears that there are no observations to the right of 14.1 so the p-value is approximately zero.
Which of the following statements is not true about the sign test?
Free
(Multiple Choice)
4.7/5 (39)
Correct Answer:Verified
A
Use the following information to answer the question. Math self-efficacy can be defined as one's belief in his or her own
ability to perform mathematical tasks. A college math professor wishes to find out if her students' math self-efficacy matches
reality. To do this she gives a math quiz then asks her students to rate their level of confidence in how well they did on the
quiz. She plans to test whether those who had little confidence that they did well on the quiz actually performed worse than
those who had a high level of confidence that they did well on the quiz. Shown below is the approximate sampling
distribution of the difference in mean quiz scores. The table below shows the summary statistics for the two groups. Assume
that all conditions for a randomization test have been satisfied. Group Mean Median Standard Deviation IQR High Conf. 106 78.6 77.5 5.5 9.5 Low Conf. 211 73.2 72.5 4.2 8.3 Test Stat: Mean High Conf. - Mean Low Conf. Number of simulations: 350
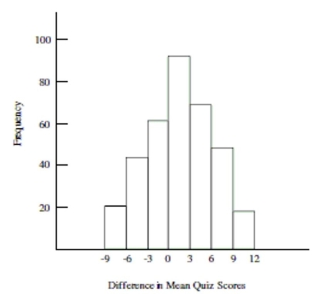 -Use the histogram to roughly estimate the p-value. Choose the answer that most closely approximates the p-value. (Approximations have been made to the nearest hundredth.)
Free
(Multiple Choice)
4.8/5 (40)
Correct Answer:Verified
A
A used car lot owner wanted to estimate the amount spent by customers during the summer months. She took a random sample of customers and recorded the amount they spent. A histogram
Showed the data was right-skewed so she took the log of each value and verified that the
Distribution of these values was more Normally distributed. What test/method should she use to
Estimate the mean amount spent during the summer months?
(Multiple Choice)
4.9/5 (39)
Use the following information to answer the question. Math self-efficacy can be defined as one's belief in his or her own
ability to perform mathematical tasks. A college math professor wishes to find out if her students' math self-efficacy matches
reality. To do this she gives a math quiz then asks her students to rate their level of confidence in how well they did on the
quiz. She plans to test whether those who had little confidence that they did well on the quiz actually performed worse than
those who had a high level of confidence that they did well on the quiz. Shown below is the approximate sampling
distribution of the difference in mean quiz scores. The table below shows the summary statistics for the two groups. Assume
that all conditions for a randomization test have been satisfied. Group Mean Median Standard Deviation IQR High Conf. 106 78.6 77.5 5.5 9.5 Low Conf. 211 73.2 72.5 4.2 8.3 Test Stat: Mean High Conf. - Mean Low Conf. Number of simulations: 350
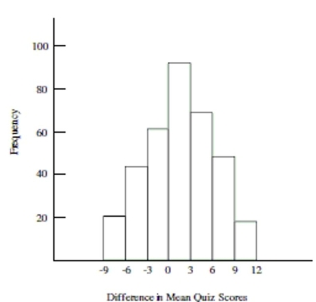 -Carry out the randomization test. What is the professor's conclusion? Are differences in mean quiz scores due to chance?
(Multiple Choice)
4.9/5 (39)
Suppose you are asked to analyze sample data but you do not know the distribution of the population it came from. Explain how a QQ plot can be used to give you information about the population from which the samples was drawn.
(Essay)
4.9/5 (41)
Which of the following statements is not true about the sign test?
(Multiple Choice)
4.7/5 (37)
State the null and alternative hypothesis to test the claim that dogs can affect anxiety levels.
(Essay)
4.8/5 (36)
Use the histogram to roughly estimate the p-value. Choose the answer that most closely approximates the p-value. (Approximations have been made to the nearest hundredth.)
(Multiple Choice)
4.8/5 (45)
Use the following information to answer the question. Suppose the Nielson Organization conducted a survey to find out how
many minutes of reality-type television programming people watched in one week. Assume that all conditions for the
Mann-Whitney test have been met. Use the following test output to answer the question. Hypothesis test results:
median for women
median for men
Parameter: m1-m2
Difference 1 2 Diff.Est Test Stat P-value Method 1-2 10 10 50 38.2 0.022 Norm. Approx.
-Choose the correct null and alternative hypothesis to test the claim that men and women watch different amounts of reality-type programming.
(Multiple Choice)
4.9/5 (39)
Describe some conditions that might indicate that sign test should be used for inference.
(Essay)
4.8/5 (34)
Suppose data was collected from ten women and twelve men about the length in minutes of their commute to work. The histogram for men was roughly normal, but the histogram for women was strongly skewed to the right. Explain why the t-test is not appropriate to test whether men and women have different commute times.
(Essay)
4.8/5 (33)
Choose the statement that is not true about the Mann-Whitney Test.
(Multiple Choice)
4.8/5 (33)
Use the following information to answer the question. Can dogs lower anxiety in math class?
Fifty subjects who reported anxiety about attending math class were measured for stress at the beginning of a math class then spent 15 minutes interacting with a dog followed by a forty-five minute math lecture. Each subject was then measured for stress at the end of the lecture. The hypothesis test results for the sign test are summarized below. Assume that all conditions for testing have been met:
Hypothesis test results:
Parameter: Median of variable
: median =0 : median 0
Variable for tests Sample Median Below Equal Above P-value Difference 50 46 1 18 4 28 0.1839
-Explain how the binomial model is used to calculate the p-value.
(Essay)
4.9/5 (36)
Use the following information to answer the question. Can stretching help you stay alert in class? Thirty-six subjects were
measured for alertness at the beginning of class; the subjects then participated in some light arm and neck stretches followed
by a forty-five minute lecture. Each subject was then measured for alertness at the end of the lecture. The hypothesis test
results for the sign test are summarized below. Assume that all conditions for testing have been met: Hypothesis test results:
Parameter: Median of variable
: median =0 : median 0
Variable for tests Sample Median Below Equal Above P-value Difference 36 32 1 12 4 20 0.2153
-Choose the correct null and alternative hypothesis.
(Multiple Choice)
4.7/5 (37)
List three of the five conditions, pertaining to the sample, which must be met in order to use the Mann-Whitney test.
(Essay)
4.7/5 (32)
A new fiber bar is advertised to curb hunger for three hours. A sample of thirty-six hungry subjects were asked to record their level of hunger before eating the fiber bar and again three hours after
Eating the fiber bar. Which test should be used to test the hypothesis there is no difference in the
Level of hunger three hours after eating the fiber bar (i.e. the fiber bar curbed hunger for three
Hours)?
(Multiple Choice)
4.9/5 (36)
Use the following information to answer the question. Can stretching help you stay alert in class? Thirty-six subjects were
measured for alertness at the beginning of class; the subjects then participated in some light arm and neck stretches followed
by a forty-five minute lecture. Each subject was then measured for alertness at the end of the lecture. The hypothesis test
results for the sign test are summarized below. Assume that all conditions for testing have been met: Hypothesis test results:
Parameter: Median of variable
: median =0 : median 0
Variable for tests Sample Median Below Equal Above P-value Difference 36 32 1 12 4 20 0.2153
-Using a significance level of 5%, state the correct decision regarding the null hypothesis and the concluding statement.
(Multiple Choice)
4.8/5 (43)
Which of the following QQ plots most closely depicts data from a skewed population?
(Multiple Choice)
4.9/5 (44)
Which of the following statements could be a reason to justify the use of the sign test?
(Multiple Choice)
4.8/5 (41)
Filters
- Essay(0)
- Multiple Choice(0)
- Short Answer(0)
- True False(0)
- Matching(0)