Exam 2: Picturing Variation With Graphs
Exam 1: Introduction to Data60 Questions
Exam 2: Picturing Variation With Graphs60 Questions
Exam 3: Numerical Summaries of Center and Variation60 Questions
Exam 4: Regression Analysis: Exploring Associations Between Variables58 Questions
Exam 5: Modeling Variation With Probability60 Questions
Exam 6: Modeling Random Events: the Normal and Binomial Models60 Questions
Exam 7: Survey Sampling and Inference60 Questions
Exam 8: Hypothesis Testing for Population Proportions60 Questions
Exam 9: Inferring Population Means60 Questions
Exam 10: Associations Between Categorical Variables59 Questions
Exam 11: Multiple Comparisons and Analysis of Variance60 Questions
Exam 12: Experimental Design: Controlling Variation60 Questions
Exam 13: Inference Without Normality60 Questions
Exam 14: Inference for Regression60 Questions
Select questions type
A fitness instructor measured the heart rates of the participants in a yoga class at the conclusion of the class. The data is summarized in the histogram below. There were fifteen people who participated in the class between the ages of 25 and 45. Use the histogram to answer the question.  -What is the approximate percentage of participants had a heart rate less than 130 bpm?
(Multiple Choice)
4.9/5  (41)
(41)
Each day for twenty days a record store owner counts the number of customers who purchase an album by a certain artist. The data and a dotplot of the data are shown below:
Data set: 1, 3, 4, 4, 5, 6, 7, 2, 3, 4, 4, 5, 6, 8, 2, 3, 4, 5, 6, 7, 9  Which of the following statements can be made using the given information?
(Multiple Choice)
4.9/5 (45)
Use the histogram below to answer the question. The histogram shows the distribution of the number of cell phones owned by 210 households of five or more people with a minimum age of nine.  -According to the histogram, about how many households do not own any cell phones?
(Essay)
4.9/5 (37)
Data were collected on hand grip strength of adults. The histogram below summarizes the data. Which statement is true about the distribution of the data shown in the graph? 
(Multiple Choice)
4.9/5 (28)
A fitness instructor measured the heart rates of the participants in a yoga class at the conclusion of the class. The data is summarized in the histogram below. There were fifteen people who participated in the class between the ages of 25 and 45.Use the histogram to answer the question.  -How many participants had a heart rate between 140 and 150 bpm?
(Multiple Choice)
4.8/5 (39)
Based on the histogram below, would it be unusual to be on hold for at least 6 minutes at this call center? 
(Multiple Choice)
4.9/5 (37)
Data was collected on the heights of a group of five boy scouts, between the ages of seven and eleven. The following heights were recorded in inches: 29, 60, 52, 57, 52. Choose the true statement:
(Multiple Choice)
4.7/5 (39)
The distribution of test scores for a group of adults on a written driving exam following a refresher course tends to be left-skewed.
(Multiple Choice)
4.8/5 (38)
The following side-by-side bar graph shows the level of post-secondary education achieved ten years after high school for graduates from the years 1999 and 2001. Use the bar graph to answer the question.
 -Which category shows the least amount of variation between years?
(Multiple Choice)
4.7/5 (42)
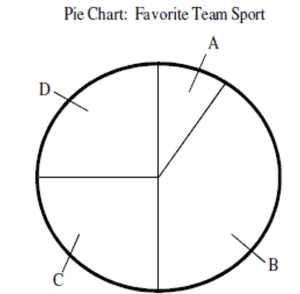
A group of junior high athletes was asked what team sport was their favorite. The data are summarized in the table below. On the pie chart, which area would correspond to the category
"Volleyball"? Team Sport Frequency Soccer 12 Volleyball 28 Basketball 20 Football 20
(Multiple Choice)
4.7/5 (41)
Use the histogram below to answer the question. The histogram shows the distribution of the number of cell phones owned by 210 households of five or more people with a minimum age of nine.  -According to the histogram, about how many households own four or more cell phones?
(Essay)
4.9/5 (33)
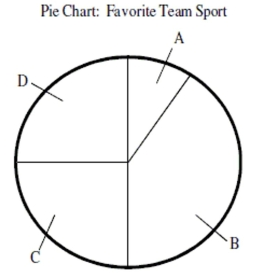
A group of junior high athletes was asked what team sport was their favorite. The data are summarized in the table below. On the pie chart, which area would correspond to the category "Soccer"?
Team Sport Frequency Soccer 12 Volleyball 28 Basketball 20 Football 20
(Multiple Choice)
4.9/5 (44)
A survey was conducted which asked college students, "What is your favorite type of take-out food?
" The results are shown in the graphs below. Use the graphs to answer the question.  -What percentage of college students preferred either Chinese or pizza?
Is this easier to determine with the bar chart or with the pie chart?
Why?
-What percentage of college students preferred either Chinese or pizza?
Is this easier to determine with the bar chart or with the pie chart?
Why?
(Essay)
4.8/5 (42)
Explain how to assess variability when presented with categorical data.
(Essay)
4.8/5 (36)
A fitness instructor measured the heart rates of the participants in a yoga class at the conclusion of the class. The data is summarized in the histogram below. There were fifteen people who participated in the class between the ages of 25 and 45. Use the histogram to answer the question.  -What percentage of the participants had a heart rate greater than 130 bpm?
(Multiple Choice)
4.7/5 (40)
The distribution of the numbers of times individuals in the 18-24 age group log onto a social networking website during the course of a day tends to be right-skewed.
(Multiple Choice)
4.9/5 (41)
The following side-by-side bar graph shows the level of post-secondary education achieved ten years after high school for graduates from the years 1999 and 2001. Use the bar graph to answer the question.  -In which category was there more variability apparent?
(Multiple Choice)
4.9/5 (32)
The following graphic was used to visually summarize the following statement made by Supertuf Bicycle Tire Company in a recent magazine advertisement: "Our patented Supertuf bicycle tire design Lasts twice as long as the leading competitor's tire design." Does the graphic correctly represent the
Statement made in the advertisement? 
(Multiple Choice)
4.7/5 (31)
You have created a histogram showing the distribution of the amount of money spent weekly on video game purchases of 120 males ages 19-25 over the last 6 months. The histogram shows that the typical amount spent by males in this age category is $35. The histogram also shows that one male reported that he spent $250 dollars on video game purchases during one of the weeks. Explain how you would use the histogram to determine whether $250 is an outlier.
(Essay)
4.9/5 (34)
The bar chart below shows car color for college students at a local community college. Use the bar chart to answer the question.  -Report the mode for males and females.
(Essay)
4.9/5 (47)
Filters
- Essay(0)
- Multiple Choice(0)
- Short Answer(0)
- True False(0)
- Matching(0)