Exam 14: Inference for Regression
Exam 1: Introduction to Data60 Questions
Exam 2: Picturing Variation With Graphs60 Questions
Exam 3: Numerical Summaries of Center and Variation60 Questions
Exam 4: Regression Analysis: Exploring Associations Between Variables58 Questions
Exam 5: Modeling Variation With Probability60 Questions
Exam 6: Modeling Random Events: the Normal and Binomial Models60 Questions
Exam 7: Survey Sampling and Inference60 Questions
Exam 8: Hypothesis Testing for Population Proportions60 Questions
Exam 9: Inferring Population Means60 Questions
Exam 10: Associations Between Categorical Variables59 Questions
Exam 11: Multiple Comparisons and Analysis of Variance60 Questions
Exam 12: Experimental Design: Controlling Variation60 Questions
Exam 13: Inference Without Normality60 Questions
Exam 14: Inference for Regression60 Questions
Select questions type
Use the following information to answer the question. A random sample of 30 couples who were also new home owners
were asked to report the cost of their first house and their combined age when they married. The output of a regression
analysis for predicting home cost from combined age is shown. Assume that the conditions of the linear regression model are
satisfied. Regression Analysis: Combined age versus home cost The regression equation is home cost =73.74+2122.75 combined age Predictor: Constant Predictor: Combined Age Parameter Estimate: 73.74 Parameter Estimate: 2122.75 Standard Error: 24.655 Standard Error: 4.814 T-statistic: 0.003 T-statistic: 4.882 p-value: 0.998 p-value: 0.008 =19837.70325-=0.8562890509 =0.9253588768
-If the slope were 1, what would that say about the association?
(Multiple Choice)
4.9/5  (38)
(38)
Use the following information to answer the question. The pulse rate of a random sample of 30 second graders was recorded before and after a fifteen minute recess. The output of a regression analysis for predicting pulse rate after recess from pulse rate before recess is shown. Assume that the conditions of the linear regression model are satisfied. Regression Analysis: Pulse before recess versus Pulse after recess The regression equation is pulse before =14.62+0.92 pulse after Predictor: Constant Predictor: Pulse before Parameter Estimate: 14.6190 Parameter Estimate: 0.9167 Standard Error: 8.536 Standard Error: 0.111 T-statistic: 1.713 T-statistic: 8.26 p-value: 0.147 p-value: 0.000 S=7.794899045 R-sq=0.036858791 =0.1919864344
-State the slope of the regression line. Write a sentence explaining what this slope means in this context.
(Essay)
4.8/5 (37)
Suppose that you were presented with data showing the association between days absent from class and final class average. Use the following residual plots, based on the data, to answer the question. a. 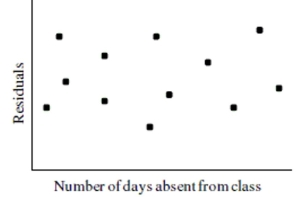 b.
b. 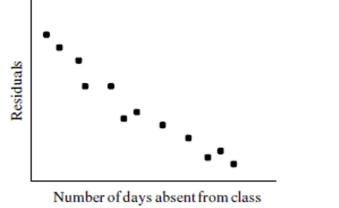 c.
c. 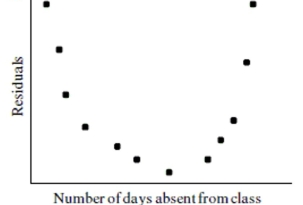 d.
d. 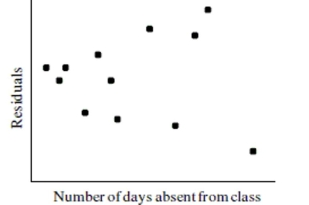 -Which of the residual plots above would suggest that the association between number of days absent from class and final class average is linear?
Explain.
-Which of the residual plots above would suggest that the association between number of days absent from class and final class average is linear?
Explain.
(Essay)
4.9/5 (39)
Use the following information to answer the question. Below is the scatterplot showing the association between the number of workers on an assembly team (x), and the number of parts assembled in an 8-hour shift (y). The residual plot of the data is also shown along with a QQ plot of the residuals. 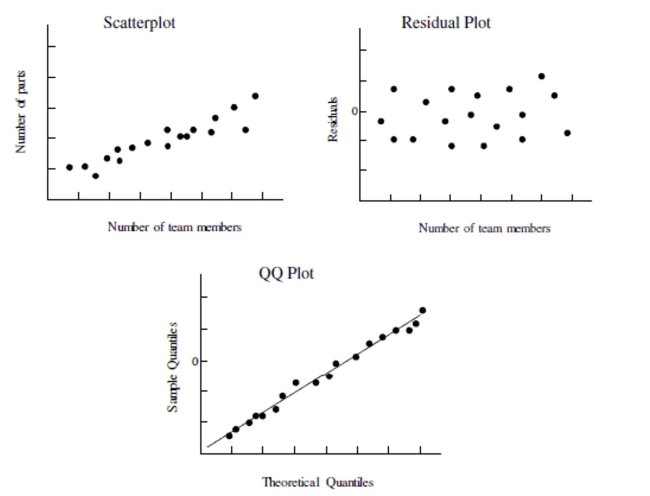 -Use the plot(s) above to explain whether the condition for linearity is satisfied.
(Essay)
4.9/5 (40)
Use the following information to answer the question. A humanities professor is interesting in learning whether there is a
positive association between average online homework scores and the final class average in an online humanities course. The
computer output below shows the results from a regression model in which the final class average was predicted by the
average online homework score. Assume that the conditions of the linear regression model are satisfied. LinRegTTest for y=a+bx \beta>0 a=-11.15986949 t=8.285803594 b=1.111745514 p=2.0898031E-4 s=4.349532611 df=124 r=.9654613007
-Choose the correct observed value of the test statistic and the p-value. Round to the nearest thousandth.
(Multiple Choice)
4.8/5 (36)
Explain the difference between confidence intervals and prediction intervals. Be sure to include the type of situation in which each type of interval would be used. Which interval is likely to be wider and why?
(Essay)
4.9/5 (33)
Use the following information to answer the question. Below is the scatterplot showing the association between raw material
(in tons) put into an injection molding machine each day (x), and the amount of scrap plastic (in tons) that is collected from
the machine every 4 weeks (y). The residual plot of the data is also shown along with a QQ plot of the residuals. 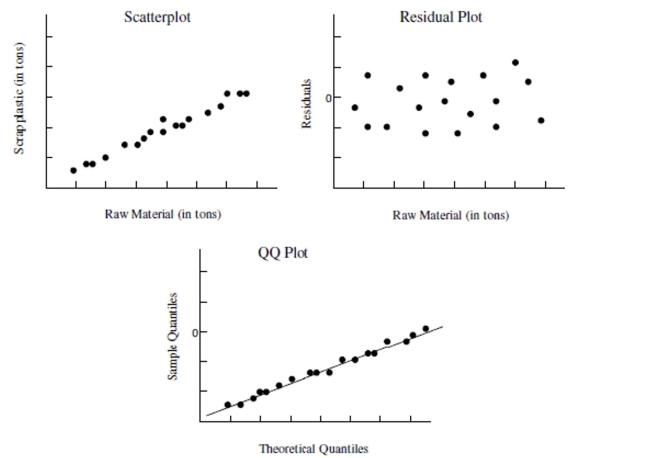 -Choose the statement that best describes whether the condition for linearity does or does not hold for the linear regression model.
(Multiple Choice)
4.9/5 (28)
Use the following information to answer the question. A random sample of 30 couples who were also new home owners
were asked to report the cost of their first house and their combined age when they married. The output of a regression
analysis for predicting home cost from combined age is shown. Assume that the conditions of the linear regression model are
satisfied. Regression Analysis: Combined age versus home cost The regression equation is home cost =73.74+2122.75 combined age Predictor: Constant Predictor: Combined Age Parameter Estimate: 73.74 Parameter Estimate: 2122.75 Standard Error: 24.655 Standard Error: 4.814 T-statistic: 0.003 T-statistic: 4.882 p-value: 0.998 p-value: 0.008 =19837.70325-=0.8562890509 =0.9253588768
-Test the hypothesis that the slope is zero (significance level is 0.05), then choose the correct decision regarding the null hypothesis and the statement that correctly summarizes the conclusion.
(Multiple Choice)
4.8/5 (43)
Which of the following is not true about residuals? If all the statements are true choose (d).
(Multiple Choice)
4.7/5 (35)
Consider the following statement:
"When the conditions of the linear model hold, the estimators for slope and intercept are unbiased." What is meant by the word unbiased in this context?
(Essay)
4.9/5 (35)
Suppose that you were presented with data showing the association between days absent from class and final class average. Use the following residual plots, based on the data, to answer the question. a. 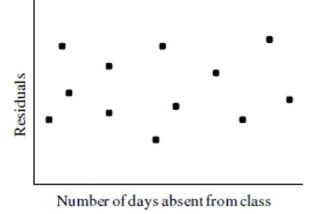 b.
b. 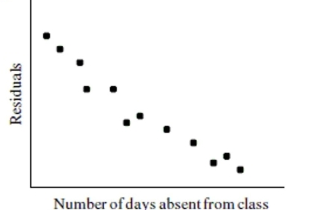 c.
c. 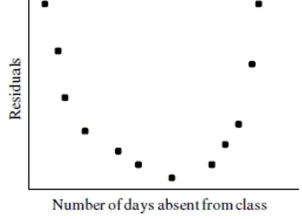 d.
d. 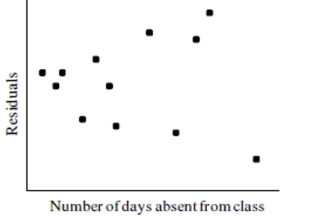 -Which of the residual plots above would suggests that the condition for constant standard deviation might not be satisfied?
Explain.
-Which of the residual plots above would suggests that the condition for constant standard deviation might not be satisfied?
Explain.
(Essay)
4.8/5 (31)
Use the following information to answer the question. A high school girls cross country coach performs a regression to
predict the finish times of runners in the 10k event from the number of minutes of training in the previous week. The output
is shown below. Assume that the conditions of the linear regression model hold. Regression Analysis: Training versus Finish Time
The regression equation is finish time training minutes
Predicted Values:
X value Pred. Y s.e. (Pred. y) 95\% C.I. 95\% P.I. 145 50.86 1.82543 (46.09,55.63) (44.85,56.87)
-Suppose the coach's top runner trained for 145 minutes the previous week. If this runner participates in the 10k event, what is the coach's expected finish time for this runner? Can he be
Reasonably confident that this runner will beat the time she had at the last meet of 51 minutes?
(Multiple Choice)
4.8/5 (32)
Which of the following is not a condition of the linear regression model?
(Multiple Choice)
4.8/5 (30)
not be satisfied because the plot shows fan shape. Explanation:
Use the following information to answer the question. Below is the scatterplot showing the association between the number of workers on an assembly team (x), and the number of parts assembled in an 8-hour shift (y). The residual plot of the data is also shown along with a QQ plot of the residuals. 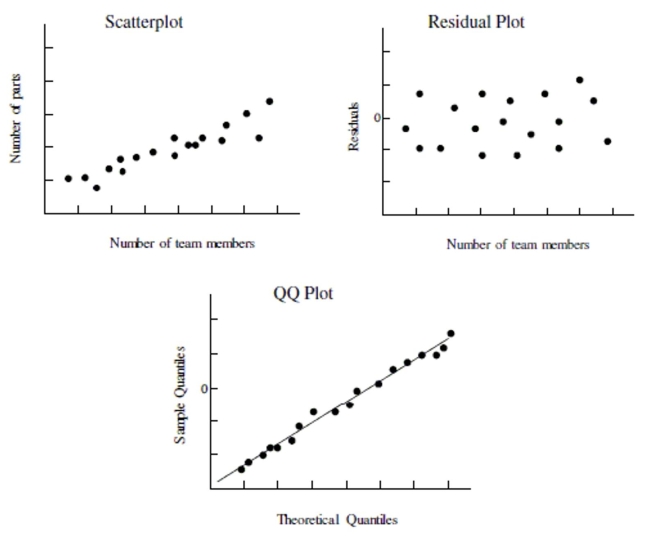 -Use the plot(s) above to explain whether the condition for normality of errors is satisfied.
(Essay)
4.8/5 (35)
Use the following information to answer the question. Below is the scatterplot showing the association between miles driven
in a semi truck (x), and the amount of tread wear on the tires (y). The residual plot of the data is also shown along with a QQ
plot of the residuals. 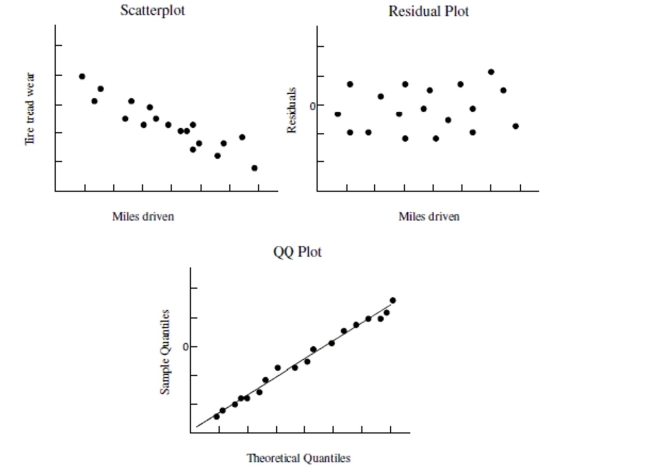 -Based on the plots provided, choose the statement that best describes whether the condition for linearity does or does not hold for the linear regression model.
(Multiple Choice)
4.8/5 (35)
Use the following information to answer the question. Below is the scatterplot showing the association between miles driven
in a semi truck (x), and the amount of tread wear on the tires (y). The residual plot of the data is also shown along with a QQ
plot of the residuals. 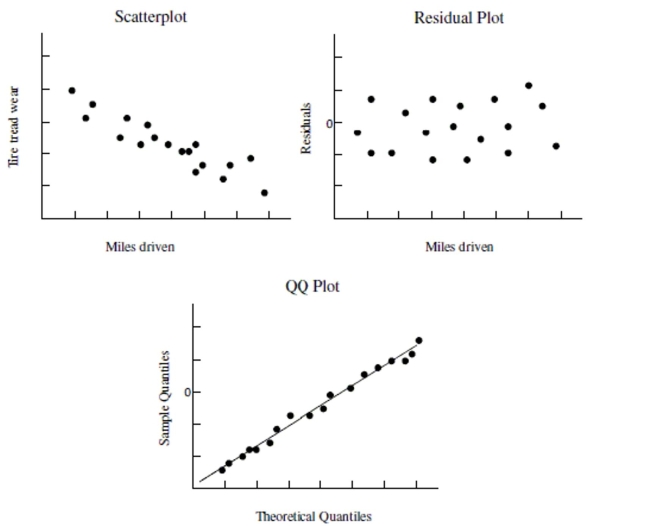 -Of the following conditions, which one can fail yet produce a regression model that is reasonably good, in many cases, if the sample size is large?
(Multiple Choice)
4.7/5 (40)
Explain how a residual plot can be useful in determining whether the condition for linearity and the condition for a constant standard deviation have been satisfied.
(Essay)
4.7/5 (40)
Use the following information to answer the question. A statistics professor is interested in learning whether there is a
positive association between number of posts by online students on a message board and the final class average in an online
statistics course. The computer output below shows the results from a regression model in which the final class average was
predicted by the number of message board posts. Assume that the conditions of the linear regression model are satisfied. LinRegTTest for y=a+bx \beta>0 a=69.7104476 t=3.707824045 b=.8144278607 p=0.0024306618 s=5.14275481 df=119 r=.7774060152
-Choose the correct decision regarding the null hypothesis and the correct conclusion. State your conclusion using a significance level of 5%.
(Multiple Choice)
4.9/5 (33)
Use the following information to answer the question. A statistics professor is interested in learning whether there is a
positive association between number of posts by online students on a message board and the final class average in an online
statistics course. The computer output below shows the results from a regression model in which the final class average was
predicted by the number of message board posts. Assume that the conditions of the linear regression model are satisfied. LinRegTTest for y=a+bx \beta>0 a=69.7104476 t=3.707824045 b=.8144278607 p=0.0024306618 s=5.14275481 df=119 r=.7774060152
-Choose the correct null and alternative hypothesis to test whether there is an association between final class average and number of message board posts.
(Multiple Choice)
4.9/5 (34)
Biologists studying the relationship between the number of Round Goby (an invasive prey fish) and the number of salmon eggs in streams believe that the deterministic component of the
Relationship is a straight line. A scatterplot shows that even though the general trend is linear, the
Points do not fall exactly on a straight line. Which of the following factors might account for the
Random component of this regression model?
(Multiple Choice)
4.8/5 (36)
Filters
- Essay(0)
- Multiple Choice(0)
- Short Answer(0)
- True False(0)
- Matching(0)