Exam 10: Correlation and Regression
Exam 1: Introduction to Statistics60 Questions
Exam 2: Exploring Data With Tables and Graphs60 Questions
Exam 3: Describing, Exploring, and Comparing Data60 Questions
Exam 4: Probability60 Questions
Exam 5: Discrete Probability Distributions59 Questions
Exam 6: Normal Probability Distributions58 Questions
Exam 7: Estimating Parameters and Determining Sample Sizes60 Questions
Exam 8: Hypothesis Testing60 Questions
Exam 9: Inferences From Two Samples60 Questions
Exam 10: Correlation and Regression60 Questions
Exam 11: Chi-Square and Analysis of Variance60 Questions
Exam 12: Control Charts and Process Monitoring178 Questions
Select questions type
Based on the scatterplot, select the most likely value of the linear correlation coefficient r. 
(Multiple Choice)
5.0/5  (34)
(34)
Suppose you will perform a test to determine whether there is sufficient evidence to support a claim of a linear correlation between two variables. Find the critical values of given the number of pairs of data and the significance level .
(Multiple Choice)
4.7/5 (38)
Based on the scatterplot, select the most likely value of the linear correlation coefficient r. 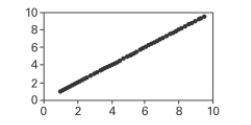
(Multiple Choice)
4.9/5 (28)
A significance level is being used to test a correlation between two variables. If the linear correlation coefficient is found to be and the critical values are what can you conclude?
(Multiple Choice)
4.9/5 (36)
A quadratic regression model is fit to a set of sample data consisting of 6 pairs of data. Given that the sum of squares of residuals is and that the -values are , find
(Multiple Choice)
4.9/5 (35)
A 0.05 significance level is being used to test a correlation between two variables. If th? linear correlation coefficient r is found to be 0.591 and the critical values are what can you conclude?
(Multiple Choice)
4.9/5 (36)
Find the value of the linear correlation coefficient . The paired data below consist of the costs of advertising (in thousands of dollars) and the number of products sold (in thousands):
Cost 9 2 3 4 2 5 9 10 Number 85 52 55 68 67 86 83 73
(Multiple Choice)
4.8/5 (39)
A regression equation is obtained for a set of data. After examining a scatter diagram, the
researcher notices a data point that is potentially an influential point. How could she
confirm that this data point is indeed an influential point?
(Essay)
4.7/5 (33)
A(n)___________________________ is a point that strongly affects the graph of the regression line.
(Multiple Choice)
4.9/5 (25)
Use computer software to find the best multiple regression equation to explain the variation in the dependent variable, Y, in terms of the independent variables, Y 456 9896 29.1 1 421 9680 42.3 2 653 10449 29.8 3 573 10811 26.0 4 CORRELATION COEFFICIENTS 546 10014 34.3 5 499 10293 22.7 6 Y/=0.509 504 9413 24.2 7 Y/=0.280 611 9860 31.6 8 Y/=0.930 646 9782 25.6 9 789 12139 37.9 10 COEFFICIENTS OF DETERMINATION 773 12166 33.9 11 753 9976 37.4 12 YI =0.259 852 10645 27.0 13 Y/=0.079 755 9738 31.5 14 Y/=0.864 815 9933 39.9 15 Y/,=0.880 902 10132 25.3 16 Y/,,=0.884 986 11145 30.4 17 909 9775 32.7 18 945 9549 35.0 19 866 10077 33.8 20 1178 11550 29.4 21 1230 10600 37.1 22 1207 11280 42.9 23 968 12100 32.2 24 1118 12420 30.5 25
(Multiple Choice)
4.8/5 (26)
Sketch a sample scatterplot of at least 5 points that would have a linear correlation coefficient
equal to −1.
(Essay)
4.8/5 (37)
The results for several randomly selected students for test 1 and test 2 grades are given
below. Test 1 59 63 65 69 58 77 76 69 70 64 Test 2 72 67 78 82 75 87 92 83 87 78
Is there sufficient evidence to suggest that there is a linear correlation between test 1 and test 2 grades? Construct a scatterplot, and find the value of the linear correlation coefficient . Also, find the -value or the critical value(s) of using .
(Essay)
4.9/5 (28)
Use the given information to find the coefficient of determination. A regression equation is obtained for a collection of paired data. It is found that the total variation is 20.711, the Explained variation is 18.592, and the unexplained variation is 2.119.
(Multiple Choice)
4.8/5 (45)
Describe what scatterplots are and discuss the importance of creating scatterplots.
(Essay)
4.8/5 (31)
A(n)___________________________ is a point lying far away from other data points on a scatterplot.
(Multiple Choice)
4.9/5 (38)
The residual is the difference between the ____________________ and the ___________________.
(Multiple Choice)
4.7/5 (32)
For each of 200 randomly selected cities, Pete recorded the number of churches in the city
(x)and the number of homicides in the past decade (y). He calculated the linear
correlation coefficient and was surprised to find a strong positive linear correlation for the
two variables. Does this suggest that building new churches causes an increase in the number
of homicides? Why do you think that a strong positive linear correlation coefficient was
obtained? Explain your answer with reference to the term lurking variable.
(Essay)
4.8/5 (39)
For the data below, determine the value of the linear correlation coefficient between and .
1.2 2.7 4.4 6.6 9.5 1.6 4.7 9.9 24.5 39.0
(Multiple Choice)
4.9/5 (31)
Find the unexplained variation for the paired data. The equation of the regression line for the paired data below is .
x 2 4 5 6 y 7 11 13 20
(Multiple Choice)
4.8/5 (51)
Provide an appropriate response. For the data below, determine the logarithmic equation, that best fits the data. Hint: Begin by replacing each -value with then use the usual methods to find the equation of the least squares regression line.
x 1.2 2.7 4.4 6.6 9.5 y 1.6 4.7 8.9 9.5 12.0
(Multiple Choice)
4.9/5 (32)
Filters
- Essay(0)
- Multiple Choice(0)
- Short Answer(0)
- True False(0)
- Matching(0)