Exam 12: Control Charts and Process Monitoring
Exam 1: Introduction to Statistics60 Questions
Exam 2: Exploring Data With Tables and Graphs60 Questions
Exam 3: Describing, Exploring, and Comparing Data60 Questions
Exam 4: Probability60 Questions
Exam 5: Discrete Probability Distributions59 Questions
Exam 6: Normal Probability Distributions58 Questions
Exam 7: Estimating Parameters and Determining Sample Sizes60 Questions
Exam 8: Hypothesis Testing60 Questions
Exam 9: Inferences From Two Samples60 Questions
Exam 10: Correlation and Regression60 Questions
Exam 11: Chi-Square and Analysis of Variance60 Questions
Exam 12: Control Charts and Process Monitoring178 Questions
Select questions type
Use the given process data to construct a control chart for p. A candy manufacturer considers a cracked piece of candy to be a defect. Each day 100 candies are randomly selected and
Checked for cracks. The numbers of defects for 20 consecutive days are given below. 14 4 5 5 5 5 5 6 6 6 6 12 6 6 6 7 6 7 8 7
What is the value of the center line?
Free
(Multiple Choice)
4.9/5  (34)
(34)
Correct Answer: Verified
C
There________ between two factors if the effect of one of the factors changes for different categories of the other factor.
Free
(Multiple Choice)
4.8/5 (37)
Correct Answer:Verified
B
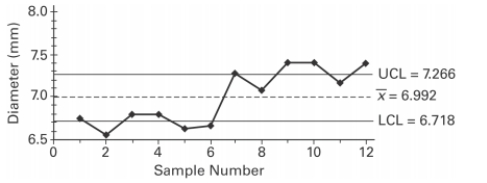
A control chart for is shown below. Determine whether the process mean is within statistical control. If it is not, identify which of the three out-of-control criteria lead to rejection of a statistically stable mean.
Free
(Essay)
4.9/5 (31)
Correct Answer:Verified
The process mean is not within statistical control. There are points above and below the control limits. There is a
shift upward.
Examine the given run chart or control chart and determine whether the process is within
statistical control. If it is not, identity which of the three out-of-statistical-control criteria
apply. A run chart for individual values W is shown below. Does there appear to be a pattern
suggesting that the process is not within statistical control? If so, describe the pattern. 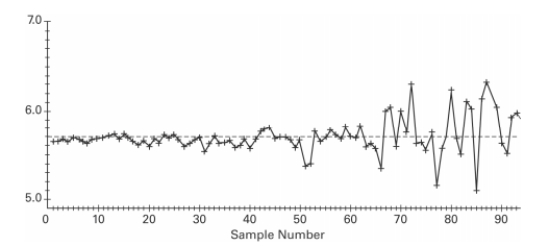
(Essay)
4.8/5 (34)
Describe the three criteria used to determine if a control chart indicates a process which is not
statistically stable.
(Essay)
4.8/5 (20)
Describe the three criteria used to determine if a control chart indicates a process which is not statistically stable.
(Essay)
4.8/5 (37)
Use the data in the given table and the corresponding Minitab display to test the hypothesis. The
following Minitab display results from a study in which three different teachers taught calculus
classes of five different sizes. The class average was recorded for each class. Assuming no
effect from the interaction between teacher and class size, test the claim that the teacher has no
effect on the class average. Use a 0.05 significance level. Source DF Teacher 2 56.93 28.47 1.018 0.404 Class Size 4 672.67 168.17 6.013 0.016 Error 8 223.73 27.97 Total 14 953.33
(Essay)
4.9/5 (36)
Use the Wilcoxon rank-sum test to test the claim that the two independent samples come from
populations with equal medians. SAT scores for students selected randomly from two different
schools are shown below. Use a significance level of 0.05 to test the claim that the scores for
the two schools are from populations with the same median.
550 480 670 460 580 620 400 700 520 380 680 570 540 740 560 660 500 480 360 560 650 600 550
(Essay)
4.8/5 (37)
Fill in the missing entries in the following partially completed one-way ANOVA table. Source df Treatment 3 14.28 Error 13.50 0.643 Total
(Essay)
4.8/5 (35)
Explain what an efficiency rating is. You may use an example to explain this concept. Do
comparable parametric or nonparametric tests have higher efficiency ratings?
(Essay)
4.8/5 (28)
Describe an R chart and give an example. What does it attempt to monitor?
(Essay)
4.8/5 (32)
The data below represent the weight losses for people on three different exercise programs. Exercise A Exercise B Exercise 2.5 5.8 4.3 8.8 4.9 6.2 7.3 1.1 5.8 9.8 7.8 8.1 5.1 1.2 7.9
If we want to test the claim that the three size categories have the same means, why don't we use three separate hypothesis tests for , and ?
(Multiple Choice)
4.7/5 (28)
Examine the given run chart or control chart and determine whether the process is within statistical control. 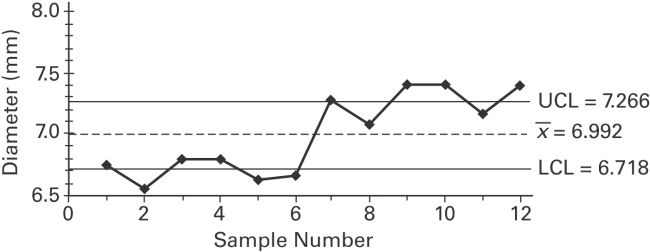
(Multiple Choice)
4.8/5 (38)
Fill in the missing entries in the following partially completed one-way ANOVA table. Source df Treatment 3 13.89 Error 13.58 0.617 Total
(Essay)
4.8/5 (44)
Sketch a control chart that indicates that a process is not statistically stable due to the run of 8
rule.
(Essay)
4.7/5 (34)
Construct an R chart and determine whether the process variation is within statistical control.
n 2 1.880 2.659 0.000 3.267 0.000 3.267 3 1.023 1.954 0.000 2.568 0.000 2.574 4 0.729 1.628 0.000 2.266 0.000 2.282 5 0.577 1.427 0.000 2.089 0.000 2.114 6 0.483 1.287 0.030 1.970 0.000 2.004 7 0.419 1.182 0.118 1.882 0.076 1.924 8 0.373 1.099 0.185 1.815 0.136 1.864 9 0.337 1.032 0.239 1.761 0.184 1.816 10 0.308 0.975 0.284 1.716 0.223 1.777
A machine that is supposed to fill small bottles to contain 20 milliliters yields the following data from a test of 4 bottles every hour.
Sample Range 1 19.9 20.1 20.2 20.3 20.125 0.4 2 20.4 20.0 20.3 20.3 20.250 0.4 3 20.0 20.7 20.4 20.3 20.350 0.7 4 20.4 20.1 20.1 19.9 20.125 0.5 5 19.9 19.8 19.6 19.5 19.700 0.4 6 19.4 19.4 19.6 19.7 19.525 0.3 7 19.8 19.4 19.6 19.7 19.625 0.4 8 19.9 19.8 20.0 20.0 19.925 0.2 9 20.2 20.3 20.1 20.3 20.225 0.2 10 20.0 20.3 20.0 20.2 20.125 0.3 11 20.3 20.5 20.1 20.2 20.275 0.4 12 20.1 19.9 19.8 19.7 19.875 0.4 13 19.5 19.8 19.7 19.6 19.650 0.3 14 19.4 19.8 19.8 19.4 19.400 0.4 15 19.5 19.6 19.6 19.9 19.650 0.4
(Essay)
4.8/5 (37)
When applying the runs test for randomness above and below the median for 10 scores on a
final exam, the test statistic is G = 2. What does that value tell us about the data?
(Essay)
4.8/5 (32)
Use the Wilcoxon rank-sum test to test the claim that the two independent samples come from
populations with equal medians. Use the Wilcoxon rank-sum approach to test the claim that
the sample student grade averages at two colleges come from populations with the same
median. The sample data is listed below. Use a 0.05 level of significance, and assume that the
samples were randomly selected. College A 3.2 4.0 2.4 2.6 2.0 1.8 1.3 0.0 0.5 1.4 2.9 College B 2.4 1.9 0.3 0.8 2.8 3.0 3.1 3.1 3.1 3.5 3.5
(Essay)
5.0/5 (27)
Sketch a run chart that that indicates that a process is not statistically stable due to increasing
variation.
(Essay)
4.9/5 (31)
A rank correlation coefficient is to be calculated for a collection of paired data. lie between -10 and 10. Which of the following could affect the value of the rank
Correlation coefficient?
I: Multiplying every value of one variable by 3
II: Interchanging the two variables
III: Adding 2 to each value of one variable
IV: Replacing every value of one variable by its absolute value
(Multiple Choice)
4.8/5 (29)
Filters
- Essay(0)
- Multiple Choice(0)
- Short Answer(0)
- True False(0)
- Matching(0)