Exam 10: Correlation and Regression
Exam 1: Introduction to Statistics60 Questions
Exam 2: Exploring Data With Tables and Graphs60 Questions
Exam 3: Describing, Exploring, and Comparing Data60 Questions
Exam 4: Probability60 Questions
Exam 5: Discrete Probability Distributions59 Questions
Exam 6: Normal Probability Distributions58 Questions
Exam 7: Estimating Parameters and Determining Sample Sizes60 Questions
Exam 8: Hypothesis Testing60 Questions
Exam 9: Inferences From Two Samples60 Questions
Exam 10: Correlation and Regression60 Questions
Exam 11: Chi-Square and Analysis of Variance60 Questions
Exam 12: Control Charts and Process Monitoring178 Questions
Select questions type
The table below lists weights (carats) and prices (dollars) for randomly selected diamonds. Is there sufficient evidence to suggest that there is a linear correlation between weights and prices? Construct a scatterplot, and find the value of the linear correlation coefficient . Also find the -value or the critical values of using .
Weight 0.3 0.4 0.5 0.5 1.0 0.7 Price 510 1151 1343 1410 5669 2277
(Essay)
4.9/5  (36)
(36)
Given the linear correlation coefficient and the sample size , determine the critical values of and use your finding to state whether or not the given represents a significant linear correlation. Use a significance level of .
(Multiple Choice)
5.0/5 (34)
The table lists the value y (in dollars)of $100 deposited in a certificate of deposit (CD)at a
bank after y years. Year 1 2 3 4 5 20 Value 103 106.09 109.27 112.55 115.93 180.61 Construct a scatterplot and identify the mathematical model that best fits the given data.
Assume that the model is to be used only for the scope of the given data, and consider only
linear, quadratic, logarithmic, exponential, and power models. Include the type of model and
the equation for the model you find.
(Essay)
4.9/5 (39)
Suppose there is significant correlation between two variables. Describe two cases under
which it might be inappropriate to use the linear regression equation for prediction. Give
examples to support these cases.
(Essay)
4.9/5 (40)
Define the terms predictor variable and response variable. Give examples for each.
(Essay)
4.8/5 (25)
The table below shows the population of a city (in millions)in each year during the The table below shows the population of a city (in millions) in each year during the period . Using the number of years since 2010 as the independent variable, find the regression equation of the best model. Assume that the model is to be used only for the scope of the given data, and consider only linear, quadratic, logarithmic, exponential, and power models. Include the type of model and the equation for the model you find.
Year 2010 2011 2012 2013 2014 2015 Population(millions) 1.08 1.37 1.68 2.19 2.73 3.34
(Essay)
4.7/5 (37)
Find the value of the linear correlation coefficient r. The paired data below consist of the temperatures on randomly chosen days and the amount a certain kind of plant grew (in Millimeters). Temperature 62 76 50 51 71 46 51 44 79 Growth 36 39 50 13 33 33 17 6 16
(Multiple Choice)
4.7/5 (37)
The following residual plot is obtained after a regression equation is determined for a set
of data. Does the residual plot suggest that the regression equation is a bad model? Why or
why not? 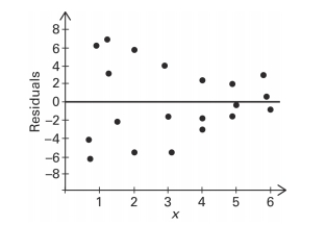
(Essay)
4.9/5 (30)
The residual is the ________________ the observed value of y and the predicted value of y.
(Multiple Choice)
4.7/5 (31)
Suppose you will perform a test to determine whether there is sufficient evidence to support a claim of a linear correlation between two variables. Find the critical value(s) of given that and .
(Multiple Choice)
4.7/5 (38)
Use the given data to find the equation of the regression line. Round the final values to three significant digits, if necessary. x 1 3 5 7 9 y 143 116 100 98 90
(Multiple Choice)
4.8/5 (30)
The following table gives the US domestic oil production rates (excluding Alaska) from 1987 to 2002. A regression equation was fit to the data and the residual plot is shown below.
Year Millions of Barrels per Day 1987 6.39 1988 6.12 1989 5.74 1990 5.58 1991 5.62 1992 5.46 1993 5.26 1994 5.10 Year Millions of Barrels per Day 1995 5.08 1996 5.07 1997 5.16 1998 5.08 1999 4.83 2000 4.85 2001 4.84 2002 4.83
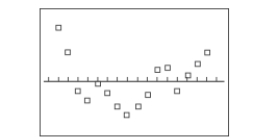 Does the residual plot suggest that the regression equation is a bad model? Why or why not?
(Essay)
4.8/5 (26)
Give an example of a pair of variables which you would expect to have a negative linear
correlation coefficient and explain why.
(Essay)
4.7/5 (32)
Give an example of a pair of variables whose linear correlation coefficient is likely to be
close to zero.
(Essay)
4.9/5 (42)
Use the given data to find the best predicted value of the response variable. Ten pairs of data yield and the regression equation . Also, . What is the best predicted value of for ?
(Multiple Choice)
4.9/5 (41)
Use the given data to find the equation of the regression line. Round the final values to three significant digits, if necessary. Productivity (x) 23 25 28 21 21 25 26 30 34 36 Dexterity ( ) 49 53 59 42 47 53 55 63 67 75
(Multiple Choice)
4.7/5 (27)
Suppose you will perform a test to determine whether there is sufficient evidence to support a claim of a linear correlation between two variables. Find the critical values of given the number of pairs of data and the significance level .
(Multiple Choice)
4.7/5 (30)
Which of the following statements concerning the linear correlation coefficient are true? I: If the linear correlation coefficient for two variables is zero, then there is no relationship
Between the variables.
II: If the slope of the regression line is negative, then the linear correlation coefficient is
Negative.
III: The value of the linear correlation coefficient always lies between −1 and 1.
IV: A linear correlation coefficient of 0.62 suggests a stronger linear relationship than a linear
Correlation coefficient of -0.82.
(Multiple Choice)
4.9/5 (39)
Construct a scatterplot for the given data. x 0.33 0.92 0.36 0.29 -0.09 0.97 0.39 0.3 y 0.5 0.49 0.08 0.27 -0.13 0.44 0.95 -0.09
(Multiple Choice)
4.8/5 (29)
Find the coefficient of determination, given that the value of the linear correlation coefficient, r, is 0.738.
(Multiple Choice)
4.8/5 (35)
Filters
- Essay(0)
- Multiple Choice(0)
- Short Answer(0)
- True False(0)
- Matching(0)