Exam 6: Normal Probability Distributions
Exam 1: Introduction to Statistics60 Questions
Exam 2: Exploring Data With Tables and Graphs60 Questions
Exam 3: Describing, Exploring, and Comparing Data60 Questions
Exam 4: Probability60 Questions
Exam 5: Discrete Probability Distributions59 Questions
Exam 6: Normal Probability Distributions58 Questions
Exam 7: Estimating Parameters and Determining Sample Sizes60 Questions
Exam 8: Hypothesis Testing60 Questions
Exam 9: Inferences From Two Samples60 Questions
Exam 10: Correlation and Regression60 Questions
Exam 11: Chi-Square and Analysis of Variance60 Questions
Exam 12: Control Charts and Process Monitoring178 Questions
Select questions type
A bank's loan officer rates applicants for credit. The ratings are normally distributed with a mean of 200 and a standard deviation of 50. Find P60, the score which separates the lower
60% from the top 40%.
Free
(Multiple Choice)
4.8/5  (29)
(29)
Correct Answer: Verified
B
If a histogram of a sample of men's ages is skewed, what do you expect to see in the normal quantile plot?
Free
(Multiple Choice)
4.9/5 (35)
Correct Answer:Verified
B
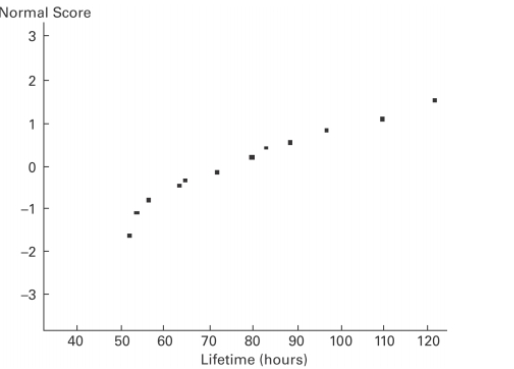
A normal quartile plot is given below for the lifetimes (in hours) of a sample of batteries of a particular brand. Use the plot to assess the normality of the lifetimes of these batteries. Explain your reasoning.
Free
(Essay)
4.7/5 (29)
Correct Answer:Verified
Since the normal quartile plot displays curvature, it appears that lifetimes of these batteries are probably not
normally distributed.
Describe what an unbiased estimator is and give an example of an unbiased estimator and a
biased estimator.
(Essay)
4.9/5 (38)
Using the following uniform density curve, answer the question. 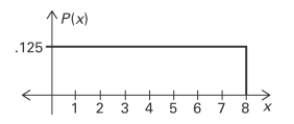 What is the probability that the random variable has a value greater than 5?
(Multiple Choice)
4.9/5 (31)
Find the indicated z score. The graph depicts the standard normal distribution with mean 0 and standard deviation 1. Shaded area is 0.4483. 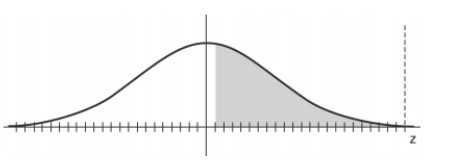
(Multiple Choice)
4.9/5 (28)
The heights of adult females are normally distributed. If you were to construct a histogram o? 40 randomly selected women, what shape would the histogram of those heights have and what
Pattern would you expect in a normal quantile plot of these data?
(Multiple Choice)
4.8/5 (33)
Heights of adult females are normally distributed. Samples of height of adult females, each of
size n = 3, are randomly collected and the sample means are found. Is it correct to conclude
that the sample means cannot be treated as a normal distribution because the sample size is so
small? Explain.
(Essay)
4.8/5 (37)
Scores on a test have a mean of 70 and is 83 . The scores have a distribution that is approximately normal. Find . (You will need to first find the standard deviation.)
(Multiple Choice)
4.9/5 (35)
Define a density curve and describe the two properties that it must satisfy. Show a density
curve for a uniform distribution. Make sure that your graph satisfies both properties.
(Essay)
4.9/5 (33)
Find the area of the shaded region. The graph depicts the standard normal distribution wit? mean 0 and standard deviation 1. 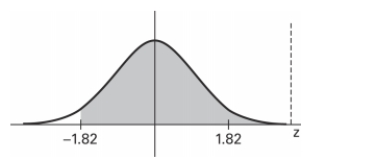
(Multiple Choice)
4.7/5 (36)
The continuity correction is used to compensate for the fact that a ___________distribution is used to approximate a ____________ distribution.
(Multiple Choice)
4.9/5 (23)
Identify three important criteria to determine if the use of a normal distribution is justified?
(Essay)
4.8/5 (34)
A normal quartile plot is given below for a sample of scores on an aptitude test. Use the
plot to assess the normality of scores on this test. Explain your reasoning. 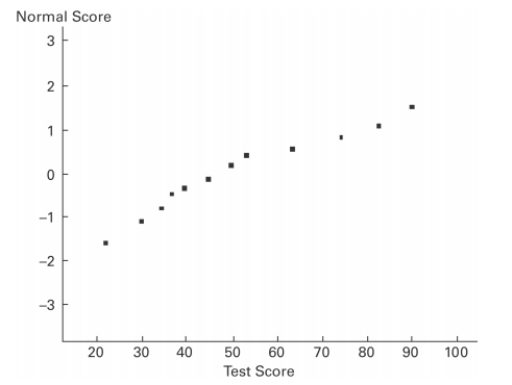
(Essay)
4.8/5 (32)
The distribution of certain test scores is a nonstandard normal distribution with a mean of 50 and a standard deviation of 6 . What are the values of the mean and standard deviation after all test scores have been standardized by converting them to -scores using ?
(Multiple Choice)
4.8/5 (34)
You will use a normal distribution to approximate a binomial distribution. Complete the following table for a distribution in which . It might be helpful to make a diagram to help you determine the continuity factor for each entry.
Find the probability that The continuity correction factor is: x is at least 12 x is at most 12 x is more than 12 x is less than 12
(Essay)
4.7/5 (38)
Scores on a test are normally distributed with a mean of and a standard deviation of . Find , which separates the bottom from the top .
(Multiple Choice)
4.9/5 (34)
If a sample size is <_____ , the sample size must come from a population having a normal distribution in order to follow normal distribution calculations.
(Multiple Choice)
4.7/5 (35)
Filters
- Essay(0)
- Multiple Choice(0)
- Short Answer(0)
- True False(0)
- Matching(0)