Exam 6: Normal Probability Distributions
Exam 1: Introduction to Statistics60 Questions
Exam 2: Exploring Data With Tables and Graphs60 Questions
Exam 3: Describing, Exploring, and Comparing Data60 Questions
Exam 4: Probability60 Questions
Exam 5: Discrete Probability Distributions59 Questions
Exam 6: Normal Probability Distributions58 Questions
Exam 7: Estimating Parameters and Determining Sample Sizes60 Questions
Exam 8: Hypothesis Testing60 Questions
Exam 9: Inferences From Two Samples60 Questions
Exam 10: Correlation and Regression60 Questions
Exam 11: Chi-Square and Analysis of Variance60 Questions
Exam 12: Control Charts and Process Monitoring178 Questions
Select questions type
The weights of college football players are normally distributed with a mean of 200 pounds and a standard deviation of 50 pounds. If a college football player is randomly selected, find The probability that he weighs between 170 and 220 pounds.
(Multiple Choice)
4.7/5  (40)
(40)
Three randomly selected households are surveyed as a pilot project for a larger survey to
be conducted later. The numbers of people in the households are 2, 3, and 8. Consider the
values of 2, 3, and 8 to be a population. Assume that samples of size n = 2 are randomly
selected with replacement from the population of 2, 3, and 8. The nine different samples are
as follows:
(2, 2), (2, 3), (2, 8), (3, 2), (3, 3), (3, 8), (8, 2), (8, 3), and (8, 8).
(i)Find the range of each of the nine samples, then summarize the sampling distribution of the
ranges in the format of a table representing the probability distribution. (ii)Compare the
population range to the mean of the sample ranges. (iii)Do the sample ranges target the value
of the population range? In general, do ranges make good estimators of population ranges?
Why or why not?
(Essay)
4.8/5 (44)
After constructing a new manufacturing machine, five prototype integrated circuit chips are
produced and it is found that two are defective and three are acceptable. Assume that two of
the chips are randomly selected with replacement from this population. After identifying the
25 possible samples, find the proportion of defects in each of them, using a table to describe
the sampling distribution of the proportions of the defects.
(Essay)
4.8/5 (33)
For the binomial distribution with n = 24 and p = 0.6, state whether or not it is suitable to use the normal distribution as an approximation.
(Multiple Choice)
4.8/5 (42)
Explain how a nonstandard normal distribution differs from the standard normal
distribution. Describe the process for finding probabilities for nonstandard normal
distributions.
(Essay)
4.8/5 (44)
A normal quartile plot is given below for the weekly incomes (in dollars)of a sample of
engineers in one town. Describe what each x value represents and what each y value
represents. Use the plot to assess the normality of the incomes of engineers in this town.
Explain your reasoning. 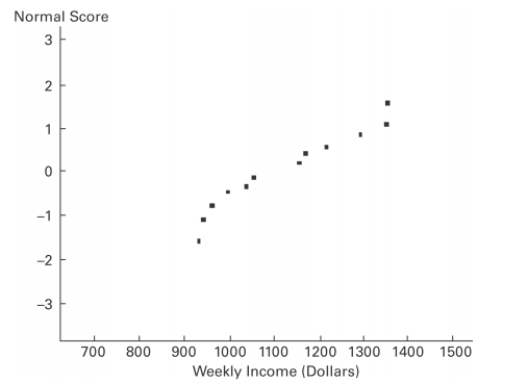
(Essay)
4.8/5 (31)
Assume that the red blood cell counts of women are normally distributed with a mean of 4.577 million cells per microliter and a standard deviation of 0.382 million cells per Microliter. Find the 80th percentile for the red blood cell counts of women.
(Multiple Choice)
4.9/5 (31)
Define the central limit theorem and its relationship to the sampling distribution of sample
means. Define how you can approximate a normal distribution from an original population
that is not normally distributed
(Essay)
4.9/5 (31)
For women aged 18-24, systolic blood pressures are normally distributed with a mean of 114.8 mm Hg and a standard deviation of 13.1 mm Hg. If 23 women aged 18-24 are randomly Selected, find the probability that their mean systolic blood pressure is between 119 and 122 mm Hg.
(Multiple Choice)
4.8/5 (43)
Estimate the indicated probability by using the normal distribution as an approximation to the binomial distribution. Estimate P(6)for n = 18 and p = 0.3.
(Multiple Choice)
4.9/5 (39)
The given values are discrete. Use the continuity correction and describe the region of the normal distribution that corresponds to the indicated probability.
The probability of no more than 35 defective CDs
(Multiple Choice)
4.9/5 (35)
A study of the amount of time it takes a mechanic to rebuild the transmission for a 2010 Chevrolet Colorado shows that the mean is 8.4 hours and the standard deviation is 1.8 hours.
If 40 mechanics are randomly selected, find the probability that their mean rebuild time is less
Than 8.9 hours.
(Multiple Choice)
4.9/5 (32)
Suppose that you wish to find for a continuous uniform distribution having a minimum of and a maximum of 3 . If you incorrectly assume that the distribution is normal instead of uniform, will your answer be too big, too small, or will you still obtain the correct answer? Explain your thinking.
(Essay)
4.8/5 (31)
Estimate the probability of getting exactly 43 boys in 90 births. Estimate the indicated probability by using the normal distribution as an approximation to the binomial distribution.
(Multiple Choice)
4.9/5 (31)
A baseball player has a batting average of 0.346, so the probability of a hit is 0.346. Assume that his hitting attempts are independent of each other. Assume that the batter gets up to bat 4 Times in each game. Estimate the probability that in 50 consecutive games, there are at least 45 games in which the batter gets at least one hit. (Hint: first find the probability that in one Game the batter gets at least one hit)
(Multiple Choice)
4.8/5 (33)
A bank's loan officer rates applicants for credit. The ratings are normally distributed with a mean of 200 and a standard deviation of 50. If an applicant is randomly selected, find the Probability of a rating that is between 200 and 275.
(Multiple Choice)
4.7/5 (31)
State the central limit theorem. Describe the sampling distribution for a population that is
uniform and for a population that is normal.
(Essay)
4.9/5 (38)
Assume that the red blood cell counts of women are normally distributed with a mean of 4.577 million cells per microliter and a standard deviation of 0.382 million cells per
Microliter. Find the value closest to the probability that a randomly selected woman has a red
Blood cell count above the normal range of 4.2 to 5.4 million cells per microliter.
(Multiple Choice)
4.8/5 (29)
In a recent year, the U.S. Mint in Denver manufactured 270 million quarters. Assume that on
each day of production, a sample of 50 quarters is randomly selected and the mean weight is
obtained. Given that the population of quarters has a mean weight of 5.67 g, what do you
know about the mean of the sample means? What do you know about the shape of the
distribution of the sample means?
(Essay)
4.9/5 (33)
Filters
- Essay(0)
- Multiple Choice(0)
- Short Answer(0)
- True False(0)
- Matching(0)