Exam 2: Exploring Data With Tables and Graphs
Exam 1: Introduction to Statistics60 Questions
Exam 2: Exploring Data With Tables and Graphs60 Questions
Exam 3: Describing, Exploring, and Comparing Data60 Questions
Exam 4: Probability60 Questions
Exam 5: Discrete Probability Distributions59 Questions
Exam 6: Normal Probability Distributions58 Questions
Exam 7: Estimating Parameters and Determining Sample Sizes60 Questions
Exam 8: Hypothesis Testing60 Questions
Exam 9: Inferences From Two Samples60 Questions
Exam 10: Correlation and Regression60 Questions
Exam 11: Chi-Square and Analysis of Variance60 Questions
Exam 12: Control Charts and Process Monitoring178 Questions
Select questions type
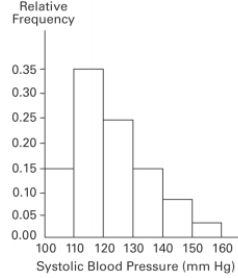
A nurse measured the blood pressure of each person who visited her clinic. Following is a relative-frequency histogram for the systolic blood pressure readings for those people
Aged between 25 and 40 years. The blood pressure readings (in mm Hg)were given to the
Nearest whole number. What class width was used to construct the relative frequency
Distribution? Systolic Blood Pressure for People Aged 25 - 40 Years
(Multiple Choice)
5.0/5  (40)
(40)
Wagenlucht Ice Cream Company is always trying to create new flavors of ice cream. They are market testing three kinds to find out which one has the best chance of becoming Popular. They give small samples of each to 20 people at a grocery store. Four ice cream Tasters preferred the Strawberry Cream, 12 preferred Choco-Nuts, and four loved the Orange Mint. Construct a Pareto chart to represent these preferences. Choose the vertical Scale so that the relative frequencies are represented.
(Multiple Choice)
4.9/5 (39)
The frequency distribution below summarizes the home sale prices in the city of Summerhill
for the month of June. Determine the class width, class midpoint, and the class boundaries
for the class 235.0-265.9. Sale Price (in thousand S) Frequency 80.0-110.9 2 111.0-141.9 5 142.0-172.9 7 173.0-203.9 10 204.0-234.9 3 235.0-265.9 1
(Essay)
4.8/5 (25)
According to USA Today, the largest categories of sports equipment sales are as follows: fishing ($2.0 billion); firearms and hunting ($3.1 billion); camping ($1.7 billion); golf ($2.5 Billion). What type of graph would depict these different categories and their relative Amounts the best?
(Multiple Choice)
4.7/5 (34)
Use the high closing values of Statstar Inc. stock from the years 2005-2016 to construct a
time-series graph. (Let x = 0 represent 2005 and so on.)Identify a trend. Year High Year High 2005 48 2011 62 2006 53 2012 60 2007 47 2013 68 2008 55 2014 42 2009 58 2015 51 2010 61 2016 78
(Essay)
4.8/5 (36)
The Kappa Iota Sigma Fraternity polled its members on the weekend party theme. The vote was as follows: six for toga, four for hayride, eight for luau, and two for masquerade.
Which of these choices display the correct Pareto chart?
(Multiple Choice)
4.8/5 (39)
x 0.51 0.02 0.14 0.29 0.34 0.8 0.47 0.71 y 0.31 0.46 -0.12 0.34 -0.05 0.8 0.35 0.47
Which of these choices display the correct scatterplot?
(Multiple Choice)
4.9/5 (35)
The following frequency distribution represents the scores on a math test. Find the class midpoint of scores for the interval 40-59. Scores Number of students 50-59 2 60-69 4 70-79 6 80-89 15 90-99 5
(Multiple Choice)
4.9/5 (32)
The frequency table below shows the amount of weight loss during the first month of a
diet program for a group of men. Constructing a frequency polygon. Applying a loose
interpretation of the requirements for a normal distribution, do the pounds of weight loss appear
to be normally distributed? Why or why not? Weight (lb) Frequency 5-7 2 8-10 9 11-13 18 14-16 13 17-19 4 20-22 1
(Essay)
4.8/5 (32)
Explain in your own words why a bar graph can be misleading if one or both of the scales
begin at some value other than zero.
(Essay)
4.8/5 (44)
The Kappa Iota Sigma Fraternity polled its members on the weekend party theme. The vote was as follows: six for toga, four for hayride, eight for luau, and two for masquerade.
Display the vote count in a Pareto chart.
(Multiple Choice)
4.8/5 (32)
The attendance counts for this season's basketball games are listed below? Which of these choices display the correct stemplot? 227 239 215 219
221 233 229 233
235 228 245 231
(Multiple Choice)
4.9/5 (46)
The following figures represent Latisha's monthly charges (in $)for long distance telephone
calls for the past twelve months.
7.12 10.40 14.70 18.24 10.48 16.47 7.53 15.45 13.04 15.48 13.33 12.56
Construct a frequency distribution with four classes.
(Essay)
4.7/5 (31)
The following data show the number of laps run by each participant in a marathon. 46 65 55 43 51 48 57 30 43 49 32 56
Which of these choices display the correct stemplot?
(Multiple Choice)
4.7/5 (38)
The two key parts of a regression equation involve the ____________ and th? y-____________.
(Multiple Choice)
4.8/5 (27)
Smoking and the episodes of lung cancer have a high correlation, but it does not prove _________.
(Multiple Choice)
4.9/5 (28)
Graphs should be constructed in a way that is fair and objective. A common deceptive graph alters the axes of the graph in what way?
(Essay)
4.7/5 (37)
Describe at least two advantages to using stemplots rather than frequency distributions.
(Essay)
4.8/5 (43)
Attendance records at a school show the number of days each student was absent during the year. The days absent for each student were as follows. 0 2 3 4 2 3 4 6 7 2 3 4 6 9 8
Which of these choices display the correct dotplot?
(Multiple Choice)
4.9/5 (38)
The ages of the 45 members of a track and field team are listed below. Which of these choices display the correct stemplot? 21 18 42 35 32 21 44 25 38 48 14 19 23 22 28
32 34 27 31 17 16 41 37 22 24 33 32 21 26 30
22 27 32 30 20 18 17 21 15 26 36 31 40 16 25
(Multiple Choice)
4.9/5 (34)
Filters
- Essay(0)
- Multiple Choice(0)
- Short Answer(0)
- True False(0)
- Matching(0)