Exam 2: Exploring Data With Tables and Graphs
Exam 1: Introduction to Statistics60 Questions
Exam 2: Exploring Data With Tables and Graphs60 Questions
Exam 3: Describing, Exploring, and Comparing Data60 Questions
Exam 4: Probability60 Questions
Exam 5: Discrete Probability Distributions59 Questions
Exam 6: Normal Probability Distributions58 Questions
Exam 7: Estimating Parameters and Determining Sample Sizes60 Questions
Exam 8: Hypothesis Testing60 Questions
Exam 9: Inferences From Two Samples60 Questions
Exam 10: Correlation and Regression60 Questions
Exam 11: Chi-Square and Analysis of Variance60 Questions
Exam 12: Control Charts and Process Monitoring178 Questions
Select questions type
The following data consists of the weights (in pounds)of 15 randomly selected women and the weights of 15 randomly selected men. Which of these choices display the correct back-
To-back stemplot?
Women: 128 150 118 166 142 122 137 110 175 152 145 126 139 111 170 Men: 140 153 199 186 169 136 176 162 196 155 173 190 141 166 153
(Multiple Choice)
4.9/5  (25)
(25)
The following frequency distribution depicts the scores on a math test. Find the class midpoint of scores for the interval 95-99. Scores Number of Students 75-79 2 80-84 4 85-89 6 90-94 15 95-99 5
(Multiple Choice)
4.9/5 (29)
The following frequency distribution analyzes the scores on a math test. Find the class boundaries of scores interval 90-99. Scores Number of Students 50-59 2 60-69 4 70-79 6 80-89 15 90-99 5
(Multiple Choice)
4.8/5 (36)
Identify the cumulative frequency distribution that corresponds to the given frequency distribution.
Speed Number of Cars 0-29 4 30-59 16 60-89 60 90-119 20
(Multiple Choice)
4.9/5 (37)
A manufacturer records the number of errors each work station makes during the week. The data are as follows. 6 3 2 3 5 2 0 2 5 4 2 0 1
Which of these choices display the correct dotplot?
(Multiple Choice)
4.8/5 (35)
Analysis of the data from 25 mothers indicates that an infant's birth weight (g), , can be estimated by a mother's weight , using the regression equation . If a mother's weight is , the infant's birth weight can be estimated as _____ .
(Multiple Choice)
4.8/5 (35)
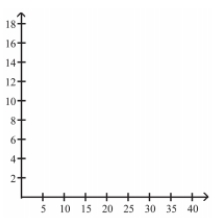
The data shows the roundtrip mileage that 43 randomly selected students drive to school
each day. Construct a frequency polygon. Applying a loose interpretation of the requirements
for a normal distribution, do the mileages appear to be normally distributed? Why or why not? Miles Frequency 10-14 0 15-19 6 20-24 9 25-29 21 30-34 7
(Essay)
4.9/5 (39)
Analysis of the data from 25 mothers indicates that an infant's birth weight (g), , can be estimated by a mother's weight , using the regression equation . For every ____kg increase in a mother's weight, the infant's birth weight increases by____ .
(Multiple Choice)
4.8/5 (31)
Identify the cumulative frequency distribution that corresponds to the given frequency distribution.
Speed Number of Cars 0-29 4 30-59 16 60-89 60 90-119 20
(Multiple Choice)
4.9/5 (36)
A store manager counts the number of customers who make a purchase in his store each day. The data are as follows. 10 11 8 14 7 10 10 11 8 7
Which of these choices display the correct dotplot?
(Multiple Choice)
4.9/5 (36)
A school district performed a study to find the main causes leading to its students
dropping out of school. Thirty cases were analyzed, and a primary cause was assigned to
each case. The causes included unexcused absences (U), illness (I), family problems (F), and
other causes (O). The results for the thirty cases are listed below:
Construct a table summarizing the frequency distribution of the primary causes leading to student dropout.
Cause Frequency
(Essay)
4.9/5 (34)
Kevin asked some of his friends how many hours they had worked during the previous
week at their after-school jobs. The results are shown below. 5 6 5 4 5 5 9 8 5 3 7 6 6 7 5 6 7 5 6 8 6 7 8 4
Construct a frequency distribution. Use 4 classes, a class width of 2 hours, and a lower limit of 3 for class
Hours Frequency
(Essay)
5.0/5 (35)
The following frequency distribution displays the scores on a math test. Find the class boundaries of scores interval 40-59. Scores Number of Students 50-59 2 60-69 4 70-79 6 80-89 15 90-99 5
(Multiple Choice)
4.8/5 (25)
Define the difference between a Relative Frequency Distribution and a Cumulative Frequency
Distribution.
(Essay)
4.8/5 (43)
The following data set represents Heather's average monthly charges (in $)for cable TV for the
past 12 months. 105 125 110 98 102 115 110 123 118 101 95 128
Construct a frequency distribution with 4 classes.
Charges Frequency
(Essay)
4.9/5 (38)
The frequency distribution below summarizes employee years of service for Alph? Corporation. Find the class midpoint for class 1 -5. Years of Service Frequency 1-5 5 6-10 20 11-15 25 16-20 10 21-25 5 26-30 3
(Multiple Choice)
4.8/5 (34)
Suppose that a data set has a minimum value of 24 and a maximum of 79 and that you want 5 classes. Explain how to find the class width for this frequency table. What happens if you mistakenly use a class width of 11 instead of 12?
(Essay)
4.8/5 (31)
Which of the following cumulative frequency distribution corresponds to the given frequency distribution?
Weight (oz) Number of Stones 1.2-1.6 5 1.7-2.1 2 2.2-2.6 5 2.7-3.1 5 3.2-3.6 13
(Multiple Choice)
4.8/5 (43)
In a survey, 26 voters were asked their ages. The results are shown below. Construct a
histogram to represent the data (with 5 classes beginning with a lower class limit of 19.5 and a
class width of 10). What is the approximate age at the center? 43 56 28 63 67 66 52 48 37 51 40 60 62 66 45 21 35 49 32 53 61 53 69 31 48 59
(Essay)
4.8/5 (36)
The frequency distribution below summarizes employee years of service for Alpha Corporation. Determine the width of each class. Years of Service Frequency 1-5 5 6-10 20 11-15 25 16-20 10 21-25 5 26-30 3
(Multiple Choice)
4.9/5 (38)
Filters
- Essay(0)
- Multiple Choice(0)
- Short Answer(0)
- True False(0)
- Matching(0)