Exam 2: Describing Motion: Kinematics in One Dimension
Exam 1: Introduction, Measurement, Estimating71 Questions
Exam 2: Describing Motion: Kinematics in One Dimension119 Questions
Exam 3: Kinematics in Two or Three Dimensions; Vectors100 Questions
Exam 4: Dynamics: Newtons Laws of Motion86 Questions
Exam 5: Using Newtons Laws: Friction, Circular Motion, Drag Forces68 Questions
Exam 6: Gravitation and Newtons6 Synthesis64 Questions
Exam 7: Work and Energy69 Questions
Exam 8: Conservation of Energy95 Questions
Exam 9: Linear Momentum85 Questions
Exam 10: Rotational Motion99 Questions
Exam 11: Angular Momentum; General Rotation45 Questions
Exam 12: Static Equilibrium; Elasticity and Fracture61 Questions
Exam 13: Fluids112 Questions
Exam 14: Oscillations102 Questions
Exam 15: Wave Motion74 Questions
Exam 16: Sound75 Questions
Exam 17: Temperature, Thermal Expansion, and the Ideal Gas Law83 Questions
Exam 18: Kinetic Theory of Gases37 Questions
Exam 19: Heat and the First Law of Thermodynamics96 Questions
Exam 20: Second Law of Thermodynamics77 Questions
Exam 21: Electric Charge and Electric Field97 Questions
Exam 22: Gausss Law44 Questions
Exam 23: Electric Potential70 Questions
Exam 24: Capacitance, Dielectrics, Electric Energy Storage73 Questions
Exam 25: Electric Currents and Resistance71 Questions
Exam 26: Dc Circuits110 Questions
Exam 27: Magnetism102 Questions
Exam 28: Sources of Magnetic Field63 Questions
Exam 29: Electromagnetic Induction and Faradays Law116 Questions
Exam 30: Inductance, Electromagnetic Oscillations, and Ac Circuits108 Questions
Exam 31: Maxwells Equations and Electromagnetic Waves76 Questions
Exam 32: Light: Reflection and Refraction118 Questions
Exam 33: Lenses and Optical Instruments134 Questions
Exam 34: The Wave Nature of Light; Interference77 Questions
Exam 35: Diffraction and Polarization68 Questions
Exam 36: Special Theory of Relativity69 Questions
Exam 37: Early Quantum Theory and Models of the Atom95 Questions
Exam 38: Quantum Mechanics42 Questions
Exam 39: Quantum Mechanics of Atoms62 Questions
Exam 40: Molecules and Solids56 Questions
Exam 41: Nuclear Physics and Radioactivity82 Questions
Exam 42: Nuclear Energy: Efects and Uses of Radiation69 Questions
Exam 43: Elementary Particle66 Questions
Exam 44: Astrophysics and Cosmology36 Questions
Select questions type
A car is 200 m from a stop sign and traveling toward the sign at 40.0 m/s. If the driver realizes they must stop the car at this time. It takes 0.20 s for the driver to apply the brakes. What must the constant acceleration of the car be after the brakes are applied so that the car would come to rest at the stop sign?
(Multiple Choice)
4.8/5  (39)
(39)
The slope of a tangent line at a given time value on a velocity versus time graph gives
(Multiple Choice)
4.9/5 (40)
Arthur and Betty start walking toward each other when they are 100 m apart. Arthur has a speed of 3.0 m/s and Betty has a speed of 2.0 m/s. How long does it take for them to meet?
(Short Answer)
4.8/5 (35)
FIGURE 2-11 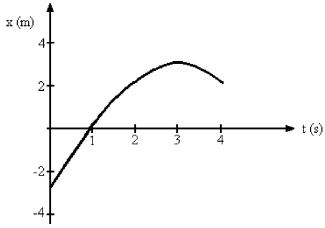 -Fig. 2-11 represents the position of a particle as it travels along the x-axis. What is the average speed of the particle between t = 1 s and t = 4 s?
(Multiple Choice)
4.9/5 (33)
A airplane that is flying level needs to accelerate from a speed of 200 m/s to a speed of 240 m/s while it flies a distance of 1200 m. What must the acceleration of the plane be?
(Multiple Choice)
4.7/5 (45)
FIGURE 2-7 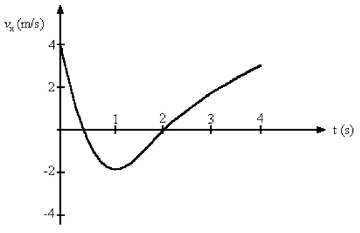 -Fig. 2-7 represents the velocity of a particle as it travels along the x-axis. In what direction is the acceleration at t = 3.0 s?
(Short Answer)
4.8/5 (34)
A runner maintains constant acceleration after starting from rest as she runs a distance of 60.0 m. The runner's speed at the end of the 60.0 m is 9.0 m/s. How much time did it take the runner to complete the 60.0 m distance?
(Multiple Choice)
4.9/5 (30)
FIGURE 2-6  -Fig. 2-6 represents the position of a particle as it travels along the x-axis. What is the average speed of the particle between t = 2 s and t = 4 s?
(Short Answer)
4.9/5 (22)
An object starts from rest at time t = 0.00 s and moves with constant acceleration. The object travels 3.00 m from time t = 1.00 s to time t = 2.00 s. What is the acceleration of the object?
(Multiple Choice)
4.9/5 (36)
FIGURE 2-11
-Fig. 2-11 represents the position of a particle as it travels along the x-axis. What is the magnitude of the average velocity of the particle between t = 1 s and t = 4 s?
(Multiple Choice)
4.9/5 (33)
A man walks south at a speed of 2.00 m/s for 15.0 minutes. He then turns around and walks north a distance 2000 m in 15.0 minutes. What is the average speed of the man during his entire motion?
(Multiple Choice)
5.0/5 (24)
A car starts from rest and accelerates with a constant acceleration of 1.00 m/s2 for 3.00 s. The car continues for 5.00 s at constant velocity. How far has the car traveled from its starting point?
(Multiple Choice)
4.9/5 (34)
Two objects are dropped from a bridge, an interval of 1.00 s apart. What is their separation 1.00 s after the second object is released?
(Multiple Choice)
4.7/5 (33)
The acceleration of an object as a function of time is given by a(t) = (3.00 m/s3)t. If the object has a velocity 1.00 m/s at time t = 1.00 s, what is the displacement of the object between time t = 2.00 s and time t = 4.00 s?
(Multiple Choice)
4.9/5 (31)
During the time that the acceleration of a particle is constant, its velocity-vs.-time curve is
(Multiple Choice)
4.7/5 (37)
An object is moving with constant non-zero velocity on the +x axis. The velocity versus time graph of this object is
(Multiple Choice)
4.8/5 (34)
Abby throws a ball straight up and times it. She sees that the ball goes by the top of a flagpole after 0.50 s and reaches the level of the top of the pole after a total elapsed time of 4.10 s. What was the speed of the ball at as it passed the top of the flagpole?
(Multiple Choice)
4.8/5 (39)
FIGURE 2-8 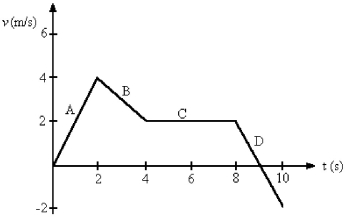 -Fig. 2-8 shows the velocity-versus-time graph for a basketball player traveling up and down the court in a straight-line path. Find the net displacement of the player for the 10 s shown on the graph.
(Multiple Choice)
4.8/5 (31)
A ball is dropped from somewhere above a window that is 2.00 m in height. As it falls, it is visible to a person looking through the window for 200 ms as it passes by the 2.00 m height of the window. From what height above the top of the window was the ball dropped?
(Multiple Choice)
4.9/5 (26)
Filters
- Essay(0)
- Multiple Choice(0)
- Short Answer(0)
- True False(0)
- Matching(0)