Exam 6: Samples and Populations
Exam 1: Why the Social Researcher Uses Statistics36 Questions
Exam 2: Organizing the Data33 Questions
Exam 3: Measures of Central Tendency37 Questions
Exam 4: Measures of Variability38 Questions
Exam 5: Probability and the Normal Curve43 Questions
Exam 6: Samples and Populations44 Questions
Exam 7: Testing Differences Between Means49 Questions
Exam 8: Analysis of Variance51 Questions
Exam 9: Nonparametric Tests of Significance48 Questions
Exam 10: Correlation47 Questions
Exam 11: Regression Analysis39 Questions
Exam 12: Nonparametric Measures of Correlation41 Questions
Exam 13: Choosing Statistical Procedures for Research Problems39 Questions
Select questions type
A frequency distribution of a large number of random sample means which have been Drawn from the same population is called:
(Multiple Choice)
4.9/5  (38)
(38)
The question below refers to the following data: 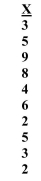 Using t-scores, calculate the 99% confidence interval. (Find the t-values in Table C of
Appendix C.)
Using t-scores, calculate the 99% confidence interval. (Find the t-values in Table C of
Appendix C.)
(Short Answer)
4.8/5 (47)
When increasing our level of confidence from 95% to 99%, the interval:
(Multiple Choice)
4.9/5 (35)
When increasing the level of confidence from 95% to 99%, we:
(Multiple Choice)
4.9/5 (39)
The question below refers to the following situation:
Given the following raw scores on a standard 10-point scale of student satisfaction: 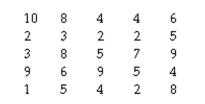 Estimate the standard error of the mean.
(Short Answer)
4.8/5 (38)
What is the standard error of the mean when analyzing the IQs of 25 adults, given that the population standard deviation of adult IQ is 10?
(Short Answer)
4.8/5 (46)
The difference between the sample mean and the population mean is called:
(Multiple Choice)
4.9/5 (39)
The question below refers to the following situation:
Given the following raw scores on a standard 10-point scale of student satisfaction: 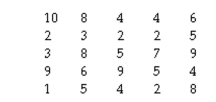 Calculate the 99% confidence interval (use the t-score method; you can find t-values in
Table C of Appendix C):
Calculate the 99% confidence interval (use the t-score method; you can find t-values in
Table C of Appendix C):
(Short Answer)
4.9/5 (31)
h a standard deviation of .3. 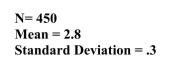 Without using t-scores, calculate the 99% confidence interval.
(Short Answer)
4.9/5 (43)
The question below refers to the following situation:
A researcher interested in school violence investigates the extent to which conflict occurs in schools. She obtains a weekly count of witnessed arguments from 15 students. The data are as follows: 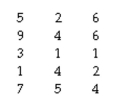 The 95% confidence interval with 14 degrees of freedom is 2.145 according to the t Table.
Therefore, the values of this confidence interval are __________.
The 95% confidence interval with 14 degrees of freedom is 2.145 according to the t Table.
Therefore, the values of this confidence interval are __________.
(Short Answer)
4.8/5 (36)
Compared with the 95% confidence interval, the 99% confidence interval is more narrow.
(True/False)
4.9/5 (46)
Regardless of how well the sampling plan has been designed, with the researcher's best Intentions, no cheating, and no mistakes, a difference between the sample mean and the Population mean known as ______ will almost always be present.
(Multiple Choice)
4.9/5 (33)
The question below refers to the following situation:
Given the following raw scores on a standard 10-point scale of student satisfaction: 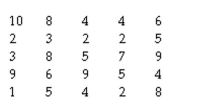 Calculate the 95% confidence interval (use the t-score method; you can find t-values in
Table C of Appendix C):
Calculate the 95% confidence interval (use the t-score method; you can find t-values in
Table C of Appendix C):
(Short Answer)
4.8/5 (37)
Which of the following is true of the sampling distribution of means?
(Multiple Choice)
4.9/5 (38)
The standard deviation of a sampling distribution of means is:
(Multiple Choice)
4.9/5 (35)
The question below refers to the following situation:
A random sample of 175 people surveyed were asked whether or not they always stop
completely at stop signs. Seventy-five percent responded that they do not.
Estimate the population proportion with a 95% confidence interval.
(Short Answer)
4.7/5 (34)
Filters
- Essay(0)
- Multiple Choice(0)
- Short Answer(0)
- True False(0)
- Matching(0)