Exam 8: Analysis of Variance
Exam 1: Why the Social Researcher Uses Statistics36 Questions
Exam 2: Organizing the Data33 Questions
Exam 3: Measures of Central Tendency37 Questions
Exam 4: Measures of Variability38 Questions
Exam 5: Probability and the Normal Curve43 Questions
Exam 6: Samples and Populations44 Questions
Exam 7: Testing Differences Between Means49 Questions
Exam 8: Analysis of Variance51 Questions
Exam 9: Nonparametric Tests of Significance48 Questions
Exam 10: Correlation47 Questions
Exam 11: Regression Analysis39 Questions
Exam 12: Nonparametric Measures of Correlation41 Questions
Exam 13: Choosing Statistical Procedures for Research Problems39 Questions
Select questions type
The question below refers to the following situation:
A social researcher is interested in studying the relationship between religious affiliation and years of education. Here is the data she is working with: 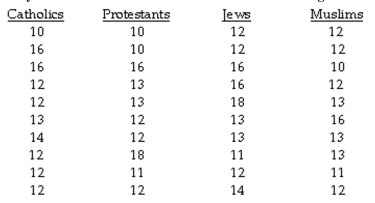 What are your conclusions about the null hypothesis?
(Essay)
5.0/5  (39)
(39)
The question below refers to the following situation:
A social researcher is interested in studying the relationship between religious affiliation and years of education. Here is the data she is working with: 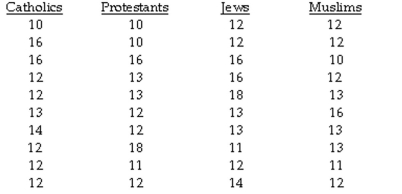 Calculate the mean square between groups (MSbetween).
(Short Answer)
4.9/5 (45)
The question below refers to the following situation:
A social researcher is interested in studying the relationship between religious affiliation and years of education. Here is the data she is working with: 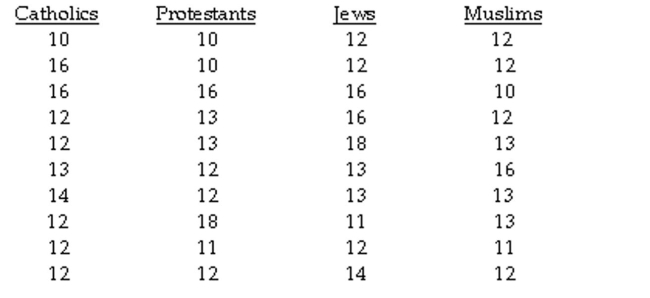 Calculate the within-group sum of squares.
(Short Answer)
4.8/5 (44)
In ANOVA, the dependent variable is measured at the interval level.
(True/False)
4.8/5 (36)
The question below refers to the following situation:
A social researcher is interested in studying the relationship between religious affiliation and years of education. Here is the data she is working with: 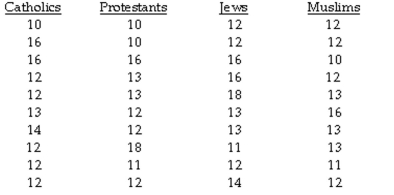 Calculate the F ratio.
(Short Answer)
4.9/5 (44)
Groups in an analysis of variance are typically formed based on a __________ measure.
(Short Answer)
4.7/5 (40)
The question below refers to the following situation:
In an analysis of variance with 4 groups, each containing 12 respondents:
Calculate the total degrees of freedom.
(Multiple Choice)
4.8/5 (44)
The question below refers to the following situation:
A valet parking attendant is interested in whether daytime temperature affects the size of
tips. To study this question, she records the size of the tip given by her customers on 3
extremely hot summer days, 3 warm spring days, and 3 cold winter days. Complete an
analysis of variance to test the differences between mean tips with significance (α = .05), to
determine if the groups differ from each other. 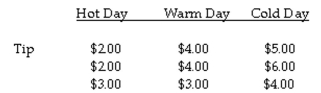 Calculate mean square between.
(Short Answer)
4.8/5 (42)
The normality assumption required for using an F ratio holds if
(Multiple Choice)
4.8/5 (39)
The question below refers to the following situation:
A social researcher is interested in studying the relationship between religious affiliation and years of education. Here is the data she is working with: 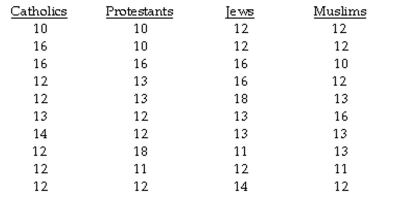 Are your results statistically significant, and if so, at what level?
(Short Answer)
4.8/5 (37)
Analysis of variance yields a(n) __________ whose numerator represents variation between
groups being compared, and whose denominator contains an estimate of variation within
those groups.
(Short Answer)
4.8/5 (40)
In Analysis of Variance, the dependent variable is measured at the nominal level.
(True/False)
4.8/5 (39)
The question below refers to the following situation:
A researcher is interested in the effects of family size on leisure time. He questions 16 families on the number of "free hours per week." He polls 4 families at each size, from 1 to 4 children. The data are as follows: 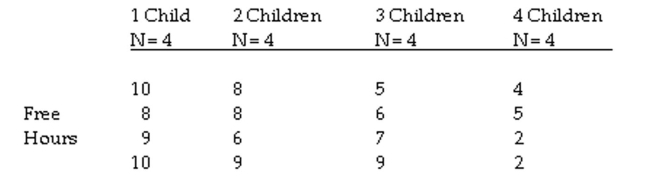 Calculate the mean square between groups.
(Short Answer)
4.7/5 (37)
The question below refers to the following situation:
A researcher is interested in the effects of family size on leisure time. He questions 16 families on the number of "free hours per week." He polls 4 families at each size, from 1 to 4 children. The data are as follows: 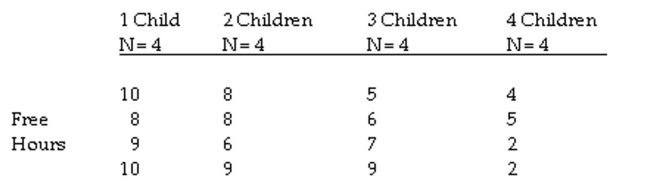 Calculate the total sum of squares.
(Short Answer)
4.8/5 (41)
In an analysis of variance with three groups, the null hypothesis states:
(Multiple Choice)
4.8/5 (45)
The distance or deviation of raw scores from their group mean is known as:
(Multiple Choice)
4.9/5 (33)
Filters
- Essay(0)
- Multiple Choice(0)
- Short Answer(0)
- True False(0)
- Matching(0)