Exam 10: Two-Sample Confidence Intervals
Exam 1: Basic Ideas39 Questions
Exam 2: Graphical Summaries of Data40 Questions
Exam 3: Numerical Summaries of Data76 Questions
Exam 4: Summarizing Bivariate Data33 Questions
Exam 5: Probability99 Questions
Exam 6: Discrete Probability Distributions76 Questions
Exam 7: The Normal Distribution131 Questions
Exam 8: Confidence Intervals62 Questions
Exam 9: Hypothesis Testing115 Questions
Exam 10: Two-Sample Confidence Intervals44 Questions
Exam 11: Two-Sample Hypothesis Tests43 Questions
Exam 12: Tests With Qualitative Data26 Questions
Exam 13: Inference in Linear Models51 Questions
Exam 14: Analysis of Variance48 Questions
Exam 15: Nonparametric Statistics27 Questions
Select questions type
Using technology, solve the following problem: A survey of college students reported that in a sample of 442 male students, the average number of energy drinks consumed per month was 2.39 With a standard deviation of 4.92, and in a sample of 77 female students, the average was 1.53 with A standard deviation of 3.07.
Construct a 90% confidence interval for the difference between men and women in the mean number Of energy drinks consumed.
(Multiple Choice)
4.9/5  (39)
(39)
Two microprocessors are compared on a sample of 6 benchmark codes to determine whether there is a difference in speed. The times (in seconds) used by each processor on each code are given below: 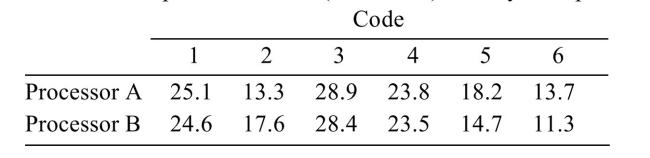 An electronics engineer claims that the mean speed is the same for both processors. Does The 99% confidence interval contradict this claim? (Hint: First find the 99% confidence interval for The difference between the mean speeds.)
(True/False)
4.8/5 (29)
Traffic engineers compared rates of traffic collisions at intersections with raised medians and rates at intersections with two-way left-turn lanes. They found that out of 4,653 collisions at intersections With raised medians, 2,289 were rear-end collisions, and out of 4,606 collisions at two-way left-turn Lanes, 2,027 were rear-end collisions.
Assuming these to be random samples of collisions from the two types of intersections, construct a 95% Confidence interval for the difference between the proportions of collisions that are of the rear-end Type at the two types of intersection.
(Multiple Choice)
4.7/5 (45)
The following MINITAB output display presents a 95% confidence interval for the difference between two proportions. Sample Sample P 1 29 628 0.046178 2 106 625 0.169600
Difference
Estimate for difference:
CI for difference:
What is the point estimate of ?
(Multiple Choice)
4.8/5 (37)
Filters
- Essay(0)
- Multiple Choice(0)
- Short Answer(0)
- True False(0)
- Matching(0)