Exam 3: Numerical Summaries of Data
Exam 1: Basic Ideas39 Questions
Exam 2: Graphical Summaries of Data40 Questions
Exam 3: Numerical Summaries of Data76 Questions
Exam 4: Summarizing Bivariate Data33 Questions
Exam 5: Probability99 Questions
Exam 6: Discrete Probability Distributions76 Questions
Exam 7: The Normal Distribution131 Questions
Exam 8: Confidence Intervals62 Questions
Exam 9: Hypothesis Testing115 Questions
Exam 10: Two-Sample Confidence Intervals44 Questions
Exam 11: Two-Sample Hypothesis Tests43 Questions
Exam 12: Tests With Qualitative Data26 Questions
Exam 13: Inference in Linear Models51 Questions
Exam 14: Analysis of Variance48 Questions
Exam 15: Nonparametric Statistics27 Questions
Select questions type
A study found that the mean amount of time that people in the United States spent watching TV was 108.1 hours per year. The same study found that the median was 109.2 hours per year. If a histogram Were constructed for the data, would you expect it to be skewed to the right, to the left, or Approximately symmetric?
Free
(Multiple Choice)
4.8/5  (38)
(38)
Correct Answer: Verified
C
The following population parameters were obtained from a graphing calculator. 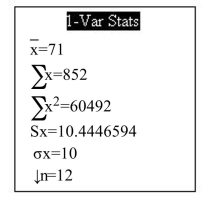 Assuming the population is bell-shaped, approximately what percentage of the population values are between 51 and 91?
Free
(Multiple Choice)
4.8/5 (37)
Correct Answer:Verified
A
Construct a boxplot for the data set below.
32 29 19 5 8 19 35 7 13 17 17 11 17 17 5 8 14 14 14 10
Free
(Multiple Choice)
4.8/5 (37)
Correct Answer:Verified
C
The mean systolic blood pressure for a sample of 500 individuals is 110 with a standard deviation of 16. A patient's systolic blood pressure is measured at 84. What is the z-score for this measurement?
(Multiple Choice)
4.9/5 (41)
Elizabeth worked at three part-time jobs last week. At one job, she worked 5 hours at a salary of $12 per hour, at the second she worked 15 hours at $10 per hour, and at the third she worked 20 Hours at $15 per hour. What was her mean hourly wage?
(Multiple Choice)
4.8/5 (40)
A data set has a mean of 50 and a standard deviation of 10. Which of the following might possibly be true?
(Multiple Choice)
4.9/5 (41)
The following table presents the number of monthly users for the 7 most popular mobile apps.
Application Monthly Users (millions) Facebook 121.1 YouTube 97.2 Facebook Messenger 95.5 Google Search 81.6 Google Play 77.0 Google Maps 75.5 Pandora Radio 73.9
Find the mean number of monthly users.
(Multiple Choice)
4.9/5 (29)
For the data set below, find the IQR. 167 171 175 183 188 188 193 200 209 250
(Multiple Choice)
4.9/5 (40)
Find the sample standard deviation for the following data set: 22 13 34 27 18
(Multiple Choice)
4.7/5 (32)
For the data set below, find the 37th percentile.
64 95 74 70 32 58 24 46 25 17 59 51 7 60 36 67 67 54 33 60
(Multiple Choice)
4.9/5 (38)
Find the mean of the data in the following stem-and-leaf plot. The leaf represents the ones digit.
1 7 2 122489 3 8 4 23
(Multiple Choice)
4.8/5 (30)
Find the population standard deviation for the following data set: 36 16 31 17 24
(Multiple Choice)
4.9/5 (38)
Find the sample variance for the following data set: 23 14 32 29 17
(Multiple Choice)
5.0/5 (33)
The following data represent the total price, in dollars, of 20 randomly-selected gasoline purchases at a certain convenience store. 53.00 64.69 46.33 72.14 56.86 67.91 47.89 66.10 61.80 44.33 61.49 45.76 80.00 79.06 41.75 59.91 49.06 52.85 46.98 10.42 Which value in this data set is most accurately described as an extreme value?
(Multiple Choice)
4.9/5 (32)
Following are the closing prices (in dollars) of a certain stock for the past 20 trading days. 149.54 131.62 132.99 144.42 132.58 133.24 135.52 139.78 152.12 134.13 126.81 131.94 133.29 142.06 156.96 139.56 125.11 158.80 129.80 144.99 Find the population standard deviation for the closing prices.
(Multiple Choice)
4.8/5 (35)
For the data set below, find the outlier(s). 210 172 252 183 183 179 191 197 169 202
(Multiple Choice)
4.8/5 (33)
For the data set below, find the upper outlier boundary. 166 174 175 183 188 190 197 204 209 253
(Multiple Choice)
4.9/5 (40)
For the data shown in the histogram, which of the following choices best describes the relationship between the median and the mean? 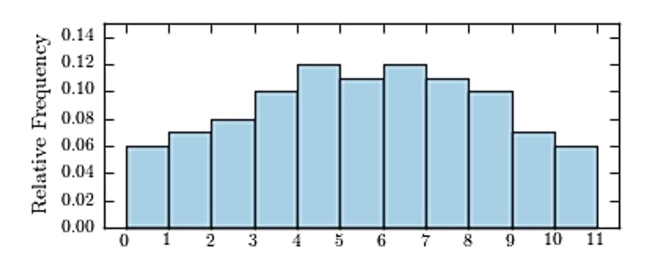
(Multiple Choice)
4.8/5 (36)
For the data set below, find the outlier(s). 150 159 159 166 181 164 164 141 169 189 169
(Multiple Choice)
4.8/5 (28)
Filters
- Essay(0)
- Multiple Choice(0)
- Short Answer(0)
- True False(0)
- Matching(0)