Exam 8: Using Data Tables and Excel Scenarios for What If Analysis
Exam 1: Applying Fundamental Excel Skills and Tools in Problem Solving150 Questions
Exam 2: Solving Problems with Statistical Analysis Tools150 Questions
Exam 3: Determining Effective Data Display with Charts150 Questions
Exam 4: Applying Logic in Decision Making150 Questions
Exam 5: Retrieving Data for Computation, Analysis, and Reference150 Questions
Exam 6: Evaluating the Financial Impact of Loans and Investments150 Questions
Exam 7: Organizing Data for Effective Analysis150 Questions
Exam 8: Using Data Tables and Excel Scenarios for What If Analysis150 Questions
Exam 9: Enhancing Decision Making with Solver150 Questions
Exam 10: Troubleshooting Workbooks and Automating Excel Applications150 Questions
Select questions type
Excel can be used to create two types of data tables: one-variable data tables and ____ data tables.
(Multiple Choice)
4.8/5  (39)
(39)
To compare scenarios, you can create a summary report that lists the scenarios side by side or in a PivotScenario.
(True/False)
4.8/5 (31)
You are faced with 100 rows of simulated profit data. You know that when using data tables for a simulation, it is helpful to calculate statistics about the data. Do you base your decisions about the data on the profit data or the statistics? What type of statistics would you run?
(Essay)
4.8/5 (40)
The textbook recommends using defined names that are fairly ____ and meaningful.
(Multiple Choice)
4.9/5 (26)
Source cells contain values, and result cells show the results of formulas. _________________________
(True/False)
4.8/5 (31)
To conduct a ____ analysis, you can ask, "How would the break-even point and profitability estimates change if an estimate about one or more other assumptions changes?"
(Multiple Choice)
4.9/5 (32)
Case 8-2
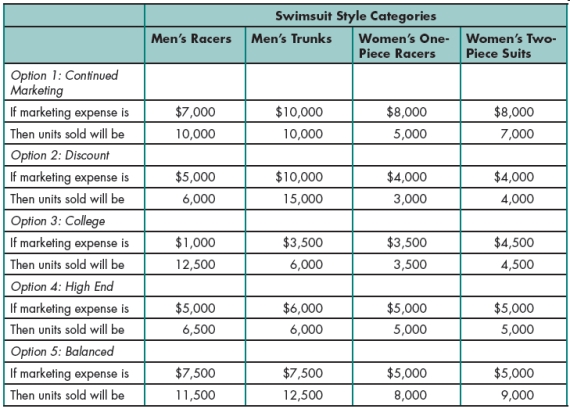 Gabriel created the table above to help him organize financial information on the projected results of increased marketing campaigns for the swimsuit line. A change in marketing expense will change the number of units sold. Please refer to the table above when answering the questions below.
-Gabriel needs to create five scenarios in the Swimwear worksheet. To do so, he needs to determine the changing cells in the worksheet. Which input values change under the various options, and what will the changing cells be in his scenarios?
Gabriel created the table above to help him organize financial information on the projected results of increased marketing campaigns for the swimsuit line. A change in marketing expense will change the number of units sold. Please refer to the table above when answering the questions below.
-Gabriel needs to create five scenarios in the Swimwear worksheet. To do so, he needs to determine the changing cells in the worksheet. Which input values change under the various options, and what will the changing cells be in his scenarios?
(Multiple Choice)
4.8/5 (32)
Case 8-2
Gabriel created the table above to help him organize financial information on the projected results of increased marketing campaigns for the swimsuit line. A change in marketing expense will change the number of units sold. Please refer to the table above when answering the questions below.
-Gabriel plans to name the input and result cells with range names. What would you recommend the name be for Option 3, "High End"?
(Multiple Choice)
4.7/5 (35)
You use data tables when you want to conduct a what-if analysis involving one or two input cells. _________________________
(True/False)
4.8/5 (40)
Scenarios are best created using sets of ____________________ value assumptions, such as best-case, likely case, and worst-case outcomes.
(Short Answer)
4.9/5 (35)
The Scenario Manager refers to input cells as ____________________ cells.
(Short Answer)
4.8/5 (33)
Both one-variable data tables and two-variable data tables have ____________________ cells, which are the cells containing values that can vary.
(Short Answer)
4.8/5 (32)
Use a(n) ____ data table to see how two factors-for example, different interest rates and loan terms-affect a loan payment.
(Multiple Choice)
4.9/5 (36)
Case 8-1
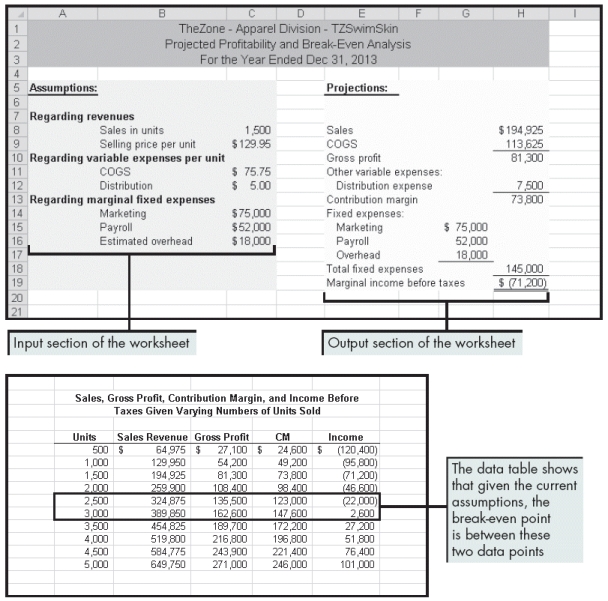 Beckham created the worksheets above to show the profitability and break-even points for his company. Please refer to the figure above as you answer the questions below.
-Beckham has received word from the Purchasing Department that there could be some variance in the COGS. He wants to develop a worksheet that shows the effects of various interactions between the selling price and the cost of goods sold per unit on profitability. In the two-variable data table, how would he set it up?
Beckham created the worksheets above to show the profitability and break-even points for his company. Please refer to the figure above as you answer the questions below.
-Beckham has received word from the Purchasing Department that there could be some variance in the COGS. He wants to develop a worksheet that shows the effects of various interactions between the selling price and the cost of goods sold per unit on profitability. In the two-variable data table, how would he set it up?
(Multiple Choice)
4.8/5 (34)
____ margins are widely used in analysis, especially when evaluating the profitability of sales alternatives and performing break-even analysis.
(Multiple Choice)
4.7/5 (43)
Scenario reports can include data from only the first ____ scenarios.
(Multiple Choice)
4.9/5 (42)
A(n) one-variable data table has only one input cell and many result cells. _________________________
(True/False)
4.8/5 (44)
To specify which input cell in the worksheet relates to the values in the data table, open the ____ dialog box.
(Multiple Choice)
4.8/5 (33)
____________________ analysis is a type of what-if analysis that concentrates on an activity at or around the point at which a product breaks even.
(Short Answer)
4.7/5 (40)
Filters
- Essay(0)
- Multiple Choice(0)
- Short Answer(0)
- True False(0)
- Matching(0)