Exam 9: Inferences From Two Samples
Exam 1: Introduction to Statistics155 Questions
Exam 2: Exploring Data With Tables and Graphs132 Questions
Exam 3: Describing, Exploring, and Comparing Data225 Questions
Exam 4: Probability219 Questions
Exam 5: Discrete Probability Distributions205 Questions
Exam 6: Normal Probability Distributions254 Questions
Exam 7: Estimating Parameters and Determining Sample Sizes170 Questions
Exam 8: Hypothesis Testing187 Questions
Exam 9: Inferences From Two Samples192 Questions
Exam 10: Correlation and Regression174 Questions
Exam 11: Goodness-Of-Fit and Contingency Tables100 Questions
Exam 12: Analysis of Variance113 Questions
Exam 13: Nonparametric Tests121 Questions
Exam 14: Statistical Process Control90 Questions
Select questions type
Assume that you want to test the claim that the paired sample data come from a population for which the mean difference is 0. Compute the value of the t test statistic. Round intermediate calculations to four decimal
Places as needed and final answers to three decimal places as needed. x 28 31 20 25 28 27 33 35 y 26 27 26 25 29 32 33 34
Free
(Multiple Choice)
4.8/5  (33)
(33)
Correct Answer: Verified
D
Assume that you plan to use a significance level of test the claim that p , Use the given sample sizes and
numbers of successes to find the pooled estimate . Round your answer to the nearest thousandth.
- =677 =3377 =172 =654
Free
(Multiple Choice)
4.7/5 (35)
Correct Answer:Verified
C
State what the given confidence interval suggests about the two population means.
-A researcher was interested in comparing the amount of time spent watching television by women and by men. Independent simple random samples of 14 women and 17 men were selected and each person was asked how
Many hours he or she had watched television during the previous week. The summary statistics are as follows. Women Men =12.7 =16.4 =4.3 =4.9 =14 =17 Construct a 95% confidence interval for the difference between the mean amount of time spent Watching television for women and the mean amount of time spent watching television for men.
Free
(Multiple Choice)
4.9/5 (43)
Correct Answer:Verified
A
A paint manufacturer made a modification to a paint to speed up its drying time. Independent simple random samples of 11 cans of type A (the original paint) and 9 cans of type B (the modified paint) were selected and
Applied to similar surfaces. The drying times, in hours, were recorded. The summary statistics are as follows. Type A Type B =76.3 =65.1 =4.5 =5.1 =11 =9 The following 98% confidence interval was obtained for the difference between the mean drying time for paint
Cans of type A and the mean drying time for paint cans of type B: What does the confidence interval suggest about the population means?
(Multiple Choice)
4.8/5 (43)
Construct a confidence interval for , the mean of the differences d for the population of paired data. Assume that the
population of paired differences is normally distributed.
-The table below shows the weights of seven subjects before and after following a particular diet for two months. Subject Before 178 167 194 154 174 156 194 After 171 158 192 159 160 158 182 Using a 0.01 level of significance, test the claim that the diet is effective in reducing weight.
(Essay)
4.9/5 (40)
Assume that you plan to use a significance level of test the claim that p , Use the given sample sizes and
numbers of successes to find the P-value for the hypothesis test.
- =100 =140 =41 =35
(Multiple Choice)
4.7/5 (35)
Determine whether the samples are independent or dependent.
-The accuracy of verbal responses is tested in an experiment in which individuals report their heights and then are measured. The data consist of the reported height and measured height for each individual.
(Multiple Choice)
4.9/5 (38)
Determine whether the samples are independent or dependent.
-A researcher wishes to determine whether people with high blood pressure can reduce their blood pressure,
measured in mm Hg, by following a particular diet. Use a significance level of 0.01 to test the claim that the
treatment group is from a population with a smaller mean than the control group. Use the traditional method of
hypothesis testing. 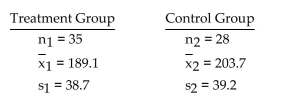
(Essay)
4.8/5 (39)
Determine whether the samples are independent or dependent.
-A researcher was interested in comparing the salaries of female and male employees at a particular company. Independent simple random samples of 8 female employees and 15 male employees yielded the following
Weekly salaries (in dollars). Female Male 495 722 518 760 562 904 556 880 1150 904 520 805 520 500 480 1005 1250 970 743 750 605 660 1640
Construct a 98% confidence interval for the difference between the mean weekly salary of female Employees and the mean weekly salary of male employees at the company.
(Multiple Choice)
4.7/5 (39)
Assume that you want to test the claim that the paired sample data come from a population for which the mean difference is Compute the value of the t test statistic. Round intermediate calculations to four decimal
Places as needed and final answers to three decimal places as needed. Subject Before 168 180 157 132 202 124 190 210 171 After 162 178 145 125 171 126 180 195 163
(Multiple Choice)
4.7/5 (45)
To test the null hypothesis that the difference between two population proportions is equal to a nonzero
constant c, use the test statistic: As long as are both large, the sampling distribution of the test statistic z will be approximately the
standard normal distribution. Given the sample data below, test the claim that the proportion of male voters
who plan to vote Republican at the next presidential election is 15 percentage points more than the percentage
of female voters who plan to vote Republican. Use the P-value method of hypothesis testing and use a significance
level of 0.10. Men:
Women:
(Essay)
5.0/5 (35)
When performing a hypothesis test for the ratio of two population variances, the upper critical value is denoted . The lower critical value, can be found as follows: interchange the degrees of freedom, and then take the reciprocal of the resulting value found in Table A-5. can be denoted and can be denoted . Find the critical values for a two-tailed hypothesis test based on the following values:
(Multiple Choice)
4.8/5 (34)
Assume that you plan to use a significance level of to test the claim that . Use the given sample sizes and numbers of successes to find the -value for the hypothesis test.
=50 =75 =20 =15
(Multiple Choice)
4.8/5 (36)
State what the given confidence interval suggests about the two population means.
-A researcher was interested in comparing the GPAs of students at two different colleges. Independent simple
random samples of 8 students from college A and 13 students from college B yielded the following GPAs. 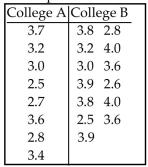 Use a 0.10 significance level to test the claim that the mean GPA of students at college A is equal to the mean
GPA of students at college B. Use the traditional method of hypothesis testing.
Use a 0.10 significance level to test the claim that the mean GPA of students at college A is equal to the mean
GPA of students at college B. Use the traditional method of hypothesis testing.
(Essay)
4.8/5 (32)
Construct a confidence interval for , the mean of the differences d for the population of paired data. Assume that the
population of paired differences is normally distributed.
-A random sample of 16 women resulted in blood pressure levels with a standard deviation of 23 mm Hg. A
random sample of 17 men resulted in blood pressure levels with a standard deviation of 19.2 mm Hg. Use a 0.05
significance level to test the claim that blood pressure levels for women vary more than blood pressure levels
for men.
(Essay)
4.8/5 (24)
When testing for a difference between the means of a treatment group and a placebo group, the computer
display below is obtained. Using a 0.05 significance level, is there sufficient evidence to support the claim that
the treatment group (variable 1) comes from a population with a mean that is less than the mean for the placebo
population? Explain. t -Test: Two Sample for Means 1 Variable 1 Variable 2 2 Mean 65.10738 66.18251 3 Known Variance 8.102938 10.27387 4 Observations 50 50 5 Hypothesized Mean Difference 0 6 t -1.773417 7 P(T<=t) one-tail 0.0384 8 T Critical one-tail 1.644853 9 P(T<=t) two tail 0.0768 10 t Critical two-tail 1.959961
(Essay)
4.8/5 (40)
Construct a confidence interval for , the mean of the differences d for the population of paired data. Assume that the
population of paired differences is normally distributed.
-A researcher wishes to compare how students at two different schools perform on a math test. He randomly
selects 40 students from each school and obtains their test scores. He pairs the first score from school A with the
first school from school B, the second score from school A with the second school from school B and so on. He
then performs a hypothesis test for matched pairs. Is this approach valid? Why or why not? If it is not valid,
how should the researcher have proceeded?
(Essay)
4.9/5 (46)
Assume that two samples are independent simple random samples selected from normally distributed populations, and do not assume that the population standard deviations are equal. Which distribution is used to
Test the claim that mothers spend more time (in minutes) driving their kids to activities than fathers do?
(Multiple Choice)
4.9/5 (42)
Determine the decision criterion for rejecting the null hypothesis in the given hypothesis test; i.e., describe the values of the test statistic that would result in rejection of the null hypothesis.
-A farmer has decided to use a new additive to grow his crops. He divided his farm into 10 plots and kept records of the corn yield (in bushels) before and after using the additive. The results are shown below. Plot: 1 2 3 4 5 6 7 8 9 10 Before 9 9 8 7 6 8 5 9 10 11 After 10 9 9 8 7 10 6 10 10 12
You wish to test the following hypothesis at the 10 percent level of significance.
What decision rule would you use?
(Multiple Choice)
4.9/5 (39)
Test the indicated claim about the means of two populations. Assume that the two samples are independent simple random samples selected from normally distributed populations. Do not assume that the population standard deviations are equal. Women Men =12.5 =13.8 =39. =5.2 =14 =17 Use a 0.05 significance level to test the claim that the mean amount of time spent watching television by women is
smaller than the mean amount of time spent watching television by men. Include your null and alternative hypotheses,
the test statistic, P-value or critical value(s), conclusion about the null hypothesis, and conclusion about the claim
in your answer.
(Essay)
4.9/5 (31)
Filters
- Essay(0)
- Multiple Choice(0)
- Short Answer(0)
- True False(0)
- Matching(0)