Exam 6: Normal Probability Distributions
Exam 1: Introduction to Statistics155 Questions
Exam 2: Exploring Data With Tables and Graphs132 Questions
Exam 3: Describing, Exploring, and Comparing Data225 Questions
Exam 4: Probability219 Questions
Exam 5: Discrete Probability Distributions205 Questions
Exam 6: Normal Probability Distributions254 Questions
Exam 7: Estimating Parameters and Determining Sample Sizes170 Questions
Exam 8: Hypothesis Testing187 Questions
Exam 9: Inferences From Two Samples192 Questions
Exam 10: Correlation and Regression174 Questions
Exam 11: Goodness-Of-Fit and Contingency Tables100 Questions
Exam 12: Analysis of Variance113 Questions
Exam 13: Nonparametric Tests121 Questions
Exam 14: Statistical Process Control90 Questions
Select questions type
Solve the problem.
-The number of books sold over the course of the four-day book fair were 152, 173, 294, and 65. Assume that
samples of size 2 are randomly selected with replacement from this population of four values. Identify the
probability of each sample, and describe the sampling distribution of the sample means.
Free
(Essay)
4.8/5  (28)
(28)
Correct Answer: Verified
Solve the problem. Round to the nearest tenth unless indicated otherwise.
-Suppose that replacement times for washing machines are normally distributed with a mean of 8.4 years and a standard deviation of 2 years. Find the replacement time that separates the top 18% from the bottom 82%.
Free
(Multiple Choice)
4.9/5 (36)
Correct Answer:Verified
D
The Precision Scientific Instrument Company manufactures thermometers that are supposed to give readings of at
the freezing point of water. Tests on a large sample of these thermometers reveal that at the freezing point of water, some
give readings below (denoted by negative numbers) and some give readings above (denoted by positive
numbers). Assume that the mean reading is and the standard deviation of the readings is Also assume that the
frequency distribution of errors closely resembles the normal distribution. A thermometer is randomly selected and
tested. Find the temperature reading corresponding to the given information.
-A quality control analyst wants to examine thermometers that give readings in the bottom 7%. Find the reading that separates the bottom 7% from the others.
Free
(Multiple Choice)
4.9/5 (25)
Correct Answer:Verified
B
Solve the problem.
-In a certain population, 10% of people are left handed. Suppose that in calculating each of the probabilities
below, you use the normal distribution as an approximation to the binomial but that you fail to use a continuity
correction. In which case will the resulting error be the greatest? In which case will the error be the least?
Explain your thinking. A: the probability that among 50 randomly selected people, at least 5 are left handed B: the probability that among 100 randomly selected people, more than 10 are left handed C: the probability that among 200 randomly selected people, at most 20 are left handed
(Essay)
4.8/5 (39)
Find the area of the shaded region. The graph depicts the standard normal distribution with mean 0 and standard
deviation 1.
-
(Multiple Choice)
4.8/5 (46)
Use the normal distribution to approximate the desired probability.
-A coin is tossed 20 times. A person, who claims to have extrasensory perception, is asked to predict the outcome of each flip in advance. She predicts correctly on 14 tosses. What is the probability of being correct 14 or more
Times by guessing? Does this probability seem to verify her claim?
(Multiple Choice)
4.7/5 (35)
Find the indicated z score. The graph depicts the standard normal distribution with mean 0 and standard deviation 1. Shaded area is 0.4483. 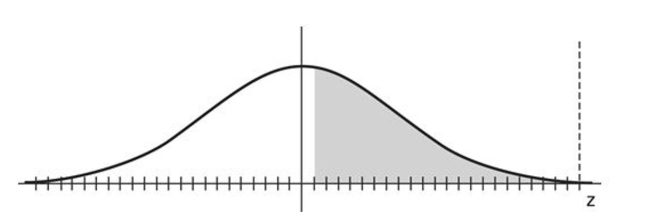
(Multiple Choice)
4.9/5 (37)
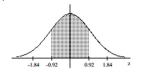
If z is a standard normal variable, find the probability that z lies between -2.41 and 0.
(Multiple Choice)
4.7/5 (32)
Solve the problem.
-Three randomly selected households are surveyed as a pilot project for a larger survey to be conducted later.
The numbers of people in the households are 3, 8, and 10. Consider the values of 3, 8, and 10 to be a population.
Assume that samples of size n = 2 are randomly selected with replacement from the population of 3, 8, and 10.
The nine different samples are as follows:
(3, 3), (3, 8), (3, 10), (8, 3), (8, 8), (8, 10), (10, 3), (10, 8), and (10, 10). (i) Find the range of each of the nine samples,
then summarize the sampling distribution of the ranges in the format of a table representing the probability
distribution. (ii) Compare the population range to the mean of the sample ranges. (iii) Do the sample ranges
target the value of the population range? In general, do ranges make good estimators of population ranges?
Why or why not.?
(Essay)
4.8/5 (44)
Assume that X has a normal distribution, and find the indicated probability.
-The mean is .2 and the standard deviation is Find the probability that X is between 14.3 and 16.1.
(Multiple Choice)
4.9/5 (36)
Assume that the weight loss for the first month of a diet program varies between 6 pounds and 12 pounds, and is spread evenly over the range of possibilities, so that there is a uniform distribution. Find the probability of the given range of pounds lost.
-Between 8 pounds and 11 pounds
(Multiple Choice)
4.8/5 (40)
Solve the problem.
-Three randomly selected households are surveyed as a pilot project for a larger survey to be conducted later.
The numbers of people in the households are 2, 4, and 10. Consider the values of 2, 4, and 10 to be a population.
Assume that samples of size n = 2 are randomly selected with replacement from the population of 2, 4, and 10.
The nine different samples are as follows: (2, 2), (2, 4), (2, 10), (4, 2), (4, 4), (4, 10), (10, 2), (10, 4), and (10, 10).
(i) Find the median of each of the nine samples, then summarize the sampling distribution of the medians in the
format of a table representing the probability distribution. (ii) Compare the population median to the mean of
the sample medians. (iii) Do the sample medians target the value of the population median? In general, do
medians make good estimators of population medians? Why or why not?
(Essay)
4.9/5 (40)
Solve the problem.
-Three randomly selected households are surveyed as a pilot project for a larger survey to be conducted later.
The numbers of people in the households are 5, 7, and 9. Consider the values of 5, 7, and 9 to be a population.
Assume that samples of size n = 2 are randomly selected with replacement from the population of 5, 7, and 9.
The nine different samples are as follows: (5, 5), (5, 7), (5, 9), (7, 5), (7, 7), (7, 9), (9, 5), (9, 7), and (9, 9). (i) Find
the mean of each of the nine samples, then summarize the sampling distribution of the means in the format of a
table representing the probability distribution. (ii) Compare the population mean to the mean of the sample
means. (iii) Do the sample means target the value of the population mean? In general, do means make good
estimators of population means? Why or why not?
(Essay)
4.9/5 (44)
Find the indicated probability.
-A bank's loan officer rates applicants for credit. The ratings are normally distributed with a mean of 200 and a standard deviation of 50. If an applicant is randomly selected, find the probability of a rating that is between 170
And 220.
(Multiple Choice)
4.7/5 (35)
Solve the problem.
-An airline experiences a no-show rate of 6%. What is the maximum number of reservations that it could accept for a flight with a capacity of 160, if it wants the probability of accommodating all reservation holders to be at
Least 95%?
(Multiple Choice)
4.9/5 (39)
Solve the problem.
-A bank's loan officer rates applicants for credit. The ratings are normally distributed with a mean of 200 and a standard deviation of 50. If 40 different applicants are randomly selected, find the probability that their mean is
Above 215.
(Multiple Choice)
4.7/5 (40)
What is the probability that the random variable has a value between 0.4 and 0.8?
(Multiple Choice)
4.9/5 (43)
Find the indicated z score. The graph depicts the standard normal distribution with mean 0 and standard deviation 1.
-Shaded area is 0.0694. 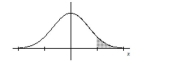
(Multiple Choice)
4.9/5 (34)
Solve the problem.
-Assume that z scores are normally distributed with a mean of 0 and a standard deviation of 1. If find a.
(Multiple Choice)
4.8/5 (40)
In a population of 210 women, the heights of the women are normally distributed with a mean of 64.4 inches and a standard deviation of 2.9 inches. If 36 women are selected at random, find the mean and standard
Deviation of the population of sample means. Assume that the sampling is done without replacement and
Use a finite population correction factor.
(Multiple Choice)
4.7/5 (34)
Filters
- Essay(0)
- Multiple Choice(0)
- Short Answer(0)
- True False(0)
- Matching(0)