Exam 10: Correlation and Regression
Exam 1: Introduction to Statistics155 Questions
Exam 2: Exploring Data With Tables and Graphs132 Questions
Exam 3: Describing, Exploring, and Comparing Data225 Questions
Exam 4: Probability219 Questions
Exam 5: Discrete Probability Distributions205 Questions
Exam 6: Normal Probability Distributions254 Questions
Exam 7: Estimating Parameters and Determining Sample Sizes170 Questions
Exam 8: Hypothesis Testing187 Questions
Exam 9: Inferences From Two Samples192 Questions
Exam 10: Correlation and Regression174 Questions
Exam 11: Goodness-Of-Fit and Contingency Tables100 Questions
Exam 12: Analysis of Variance113 Questions
Exam 13: Nonparametric Tests121 Questions
Exam 14: Statistical Process Control90 Questions
Select questions type
Suppose you will perform a test to determine whether there is sufficient evidence to support a claim of a linear
correlation between two variables. Find the critical values of r given the number of pairs of data n and the significance
level
-Given: The linear correlation coefficient between scores on a math test and scores on a test of athletic ability is
negative and close to zero.
Conclusion: People who score high on the math test tend to score lower on the test of athletic ability.
Free
(Essay)
4.8/5  (39)
(39)
Correct Answer: Verified
Because the linear correlation coefficient is close to zero and is probably not significant, no conclusion can
be reached regarding the relationship between scores on the math test and scores on the test of athletic
ability.
Suppose you will perform a test to determine whether there is sufficient evidence to support a claim of a linear
correlation between two variables. Find the critical values of r given the number of pairs of data n and the significance
level
-Ten pairs of data yield and the regression equation Also, . What is the best predicted value of for ?
Free
(Multiple Choice)
4.7/5 (42)
Correct Answer:Verified
C
Use the given data to find the equation of the regression line. Round the final values to three significant digits, if necessary.
- x 2 4 5 6 y 7 11 13 20
Free
(Multiple Choice)
4.9/5 (33)
Correct Answer:Verified
B
Which of the following statements concerning the linear correlation coefficient are true? I: If the linear correlation coefficient for two variables is zero, then there is no relationship between the variables.
II: If the slope of the regression line is negative, then the linear correlation coefficient is negative.
III: The value of the linear correlation coefficient always lies between -1 and 1.
IV: A linear correlation coefficient of 0.62 suggests a stronger linear relationship than a linear correlation coefficient of
-0)82.
(Multiple Choice)
4.8/5 (43)
Use computer software to find the multiple regression equation. Can the equation be used for prediction?
-FPEA, the Farm Production Enhancement Agency, regressed corn output against acreage, rainfall, and a trend line. The trend line is proxy for technological advancement in farming from improved pest control, fertilization,
Land management, and farming implements. 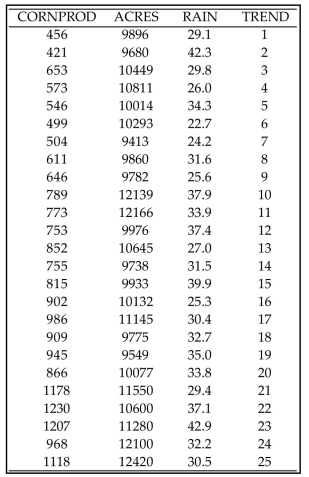
(Multiple Choice)
4.9/5 (40)
Applicants for a particular job, which involves extensive travel in Spanish speaking countries, must take a
proficiency test in Spanish. The sample data below were obtained in a study of the relationship between the
numbers of years applicants have studied Spanish (x) and their score on the test (y). 3 4 4 2 5 3 4 5 3 2 57 78 72 58 89 63 73 84 75 48 The regression equation was obtained. Construct a residual plot for the data. 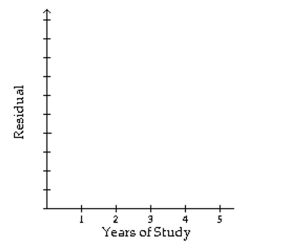
(Essay)
4.8/5 (35)
Given the linear correlation coefficient r and the sample size n, determine the critical values of r and use your finding to state whether or not the given r represents a significant linear correlation. Use a significance level of
0)05.
(Multiple Choice)
4.9/5 (35)
Suppose you will perform a test to determine whether there is sufficient evidence to support a claim of a linear
correlation between two variables. Find the critical values of r given the number of pairs of data n and the significance
level
-The regression equation relating attitude rating and job performance rating for the employees of a company is . Ten pairs of data were used to obtain the equation. The same data yield and . What is the best predicted job performance rating for a person whose attitude rating is 73 ?
(Multiple Choice)
4.9/5 (47)
Use the given data to find the equation of the regression line. Round the final values to three significant digits, if necessary.
- 3 5 7 15 16 8 11 7 14 20
(Multiple Choice)
4.7/5 (34)
Find the unexplained variation for the paired data.
-The paired data below consists of test scores and hours of preparation for 5 randomly selected students. The equation of the regression line is . Find the unexplained variation.
x Hours of preparation 5 2 9 6 10 y Test score 64 48 72 73 80
(Multiple Choice)
4.8/5 (25)
Construct a scatterplot for the given data. x 0.33 0.92 0.36 0.29 -0.09 0.97 0.39 0.3 y 0.5 0.49 0.08 0.27 -0.13 0.44 0.95 -0.09
(Multiple Choice)
4.7/5 (47)
Use the given data to find the equation of the regression line. Round the final values to three significant digits, if necessary.
-Managers rate employees according to job performance and attitude. The results for several randomly selected employees are given below.
Performance Attitude
\begin{tabular}{l|l|l|l|l|l|l|l|l|l}
59 & 63 & 65 & 69 & 58 & 77 & 76 & 69 & 70 & 64 \\
\hline 72 & 67 & 78 & 82 & 75 & 87 & 92 & 83 & 87 & 78
\end{tabular}
(Multiple Choice)
4.8/5 (31)
Suppose you will perform a test to determine whether there is sufficient evidence to support a claim of a linear correlation between two variables. Find the critical value(s) of r given that and .
(Multiple Choice)
4.8/5 (36)
Use computer software to find the best multiple regression equation to explain the variation in the dependent variable, Y, in terms of the independent variables,
- 98.6 87.4 108.5 101.2 97.6 110.1 102.4 96.7 110.4 CORRELATION COEFFICIENTS 100.9 98.2 104.3 /=0.850 102.3 99.8 107.2 /=0.742 101.5 100.5 105.8 101.6 103.2 107.8 101.6 107.8 103.4 /=0.723 99.8 96.6 102.7 =0.550 100.3 88.9 104.1 ,=0.867 97.6 75.1 99.2 97.2 76.9 99.7 97.3 84.6 102.0 96.0 90.6 94.3 99.2 103.1 97.7 100.3 105.1 101.1 100.3 96.4 102.3 104.1 104.4 104.4 105.3 110.7 108.5 107.6 127.1 111.3
(Multiple Choice)
4.8/5 (40)
Use computer software to obtain the multiple regression equation. Use the estimated equation to find the predicted value.
-A wildlife analyst gathered the data in the table to develop an equation to predict the weights of bears. He used WEIGHT as the dependent variable and CHEST, LENGTH, and SEX as the independent variables. For SEX, he
Used male = 1 and female = 2. He took his equation "to the forest" and found a male bear whose chest measured 40.3 inches and who was 64.0 inches long. WEIGHT CHEST LENGTH SEX 344 45.0 67.5 1 416 54.0 72.0 1 220 41.0 70.0 2 360 49.0 68.5 1 332 44.0 73.0 1 140 32.0 63.0 2 436 48.0 72.0 1 132 33.0 61.0 2 356 48.0 64.0 2 150 35.0 59.0 1 202 40.0 63.0 2 365 50.0 70.5 1
(Multiple Choice)
5.0/5 (41)
Sketch a sample scatterplot of at least 5 points that would have a linear correlation coefficient equal to -1.
(Essay)
4.8/5 (34)
Suppose you will perform a test to determine whether there is sufficient evidence to support a claim of a linear correlation between two variables. Find the critical values of r given the number of pairs of data n and the
Significance level
(Multiple Choice)
4.9/5 (39)
Describe the standard error of estimate, . How do smaller values of se relate to the dispersion of data points
about the line determined by the linear regression equation? What does it mean when is 0?
(Essay)
4.9/5 (37)
Use computer software to find the best multiple regression equation to explain the variation in the dependent variable, Y, in terms of the independent variables, Y X X 15 1.2 16 15 1.2 16 CORRELATION COEFFICIENT 17 1.0 16 Y/=0.886 6 0.8 9 Y/=0.965 1 0.1 1 8 0.8 8 Y/=0.932 10 0.8 10 Y/,=0.943 17 1.0 16 15 1.2 15 COEFFICIENTS OF DETERMINATION 11 0.7 9 18 1.4 18 16 1.0 15 10 0.8 9 7 0.5 5 18 1.1 16
(Multiple Choice)
5.0/5 (37)
Below are the productivity, dexterity, and job satisfaction ratings of ten randomly selected employees. Productivity ( ) 23 25 28 21 21 25 26 30 34 36 Dexterity ( ) 43 53 59 42 47 53 55 63 67 75 Satisfaction ( ) 56 58 60 50 54 61 59 63 67 69 Find the multiple regression equation that expresses the job satisfaction scores in terms of the productivity and dexterity scores.
(Multiple Choice)
4.8/5 (36)
Filters
- Essay(0)
- Multiple Choice(0)
- Short Answer(0)
- True False(0)
- Matching(0)