Exam 13: Nonparametric Tests
Exam 1: Introduction to Statistics155 Questions
Exam 2: Exploring Data With Tables and Graphs132 Questions
Exam 3: Describing, Exploring, and Comparing Data225 Questions
Exam 4: Probability219 Questions
Exam 5: Discrete Probability Distributions205 Questions
Exam 6: Normal Probability Distributions254 Questions
Exam 7: Estimating Parameters and Determining Sample Sizes170 Questions
Exam 8: Hypothesis Testing187 Questions
Exam 9: Inferences From Two Samples192 Questions
Exam 10: Correlation and Regression174 Questions
Exam 11: Goodness-Of-Fit and Contingency Tables100 Questions
Exam 12: Analysis of Variance113 Questions
Exam 13: Nonparametric Tests121 Questions
Exam 14: Statistical Process Control90 Questions
Select questions type
Use the runs test to determine whether the given sequence is random. Use a significance level of 0.05. The outcomes (odd number or even number) of a roulette wheel are shown below. Test for randomness of odd (O)
And even (E) numbers. Use a significance level of 0.05. What is the value of G, the number of runs?
Free
(Multiple Choice)
4.9/5  (47)
(47)
Correct Answer: Verified
B
A sample of 15 clock radios is selected in sequence from an assembly line. Each radio is examined and judged to
be acceptable (A) or defective (D). The results are shown below. Test for randomness. D D A A A
A A A A A
A A D D D
Free
(Essay)
4.8/5 (29)
Correct Answer:Verified
cutoff values: 3,12 .
Reject the null hypothesis of randomness.
Do parametric or nonparametric tests have higher efficiency ratings?
Free
(Multiple Choice)
4.9/5 (40)
Correct Answer:Verified
A
The systolic blood pressure readings of ten subjects before and after following a particular diet for a month are
shown in the table. Use Wilcoxon's signed-ranks test and a 0.01 significance level to test the claim that the diet
has no effect on systolic blood pressure. 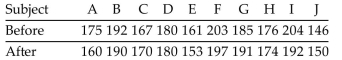
(Essay)
4.7/5 (43)
Solve the problem. Critical values for the runs test for randomness can be calculated by listing all possible
sequences. Using the elements B, B, B, R, R, R list the 20 different possible sequences. Find the number of runs
for each sequence. Are you able to find 5% cutoff values for G? What do you conclude?
(Essay)
4.8/5 (43)
Use the runs test to determine whether the given sequence is random. Use a significance level of 0.05. The sequence of
numbers below represents the maximum temperature (in degrees Fahrenheit) in July in one U.S. town for 30
consecutive years. Test the sequence for randomness above and below the median. 94 96 97 99 95 90 97 98 100 100 92 95 98 99 102 97 97 101 99 100 98 95 93 99 101 99 101 100 99 103
(Essay)
4.7/5 (40)
Use Wilcoxon's signed-ranks test and a 0.05 significance level to test the claim that the population of of
differences between the mathematics and verbal scores has a median of zero. Mathematics 347 440 327 456 427 349 377 398 425 Verbal 285 378 243 371 340 271 294 322 385
(Essay)
4.7/5 (33)
Use the Wilcoxon signed -ranks test to test the claim that the matched pairs have differences that come from a
population with a median equal to zero. Eleven runners are timed at the 100-meter dash and are timed again
one month later after following a new training program. The times (in seconds) are shown in the table. Use
Wilcoxon's signed-ranks test and a significance level of 0.05 to test the claim that the training has no effect on the times. Before 12.1 12.4 11.7 11.5 11.0 11.8 12.3 10.8 12.6 12.7 10.7 After 11.9 12.4 11.8 11.4 11.2 11.5 12.0 10.9 12.0 12.2 11.1
(Essay)
4.9/5 (39)
Explain what an efficiency rating is. You may use an example to explain this concept. Do comparable
parametric or nonparametric tests have higher efficiency ratings?
(Essay)
4.9/5 (47)
Use a Kruskal-Wallis test to test the claim that the samples come from populations with equal medians. The
table below shows the weights (in pounds) of 6 randomly selected women in each of three different age groups.
Use a 0.01 significance level to test the claim that the 3 age-groups have the same median weight. 18-34 35-55 56 and older 119 123 140 134 147 128 114 135 59 125 110 134 153 154 120 138 163 116
(Essay)
4.8/5 (34)
The following scatterplot shows the percentage of the vote a candidate received in the 2004 senatorial elections according to the voter's income level based on an exit poll of voters conducted by CNN. The income levels 1-8 correspond to the following income classes: 1=Under $15,000; 2=$15-30,000; 3=$30-50,000; 4=$50-75,000; 5=$75-100,000; 6=$100-150,000;
7=$150-200,000; 8=$200,000 or more. 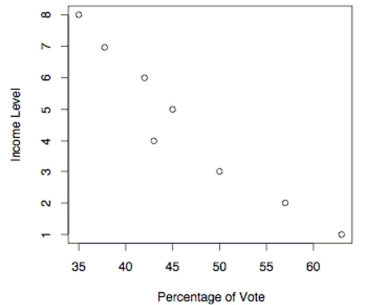 -Use the election scatterplot to the find the value of the rank correlation coefficient
(Multiple Choice)
4.8/5 (34)
Use the rank correlation coefficient to test for a correlation between the two variables. A placement test is
required for students desiring to take a finite mathematics course at a university. The instructor of the course
studies the relationship between students' placement test score and final course score. A random sample of eight
students yields the following data. Placement Score Final Course Score 63 90 41 95 54 51 32 86 93 74 60 60 61 57 89 Compute the rank correlation coefficient, rs, of the data and test the claim of correlation between placement score
and final course score. Use a significance level of 0.05.
(Essay)
4.9/5 (38)
Use a Kruskal-Wallis test to test the claim that the samples come from populations with equal medians. Listed
below are grade averages for randomly selected students with three different categories of high-school
background. At the 0.05 level of significance, test the claim that the three groups have the same median grade
average. HIGH SCHOOL RECORD Good Fair Poor 3.21 2.87 2.01 3.65 3.05 2.31 1.00 2.00 2.98 3.12 0.00 0.50 2.75 1.98 2.36
(Essay)
4.8/5 (38)
Use the sign test to test the indicated claim. Fourteen people rated two brands of soda on a scale of 1 to 5. Brand A 2 3 2 4 3 1 2 Brand B 1 4 5 5 1 2 3 Brand A 5 4 2 1 1 4 3 Brand B 4 5 5 2 4 5 4 At the 5 percent level, test the null hypothesis that the two brands of soda are equally popular.
(Essay)
4.8/5 (44)
A teacher uses two different CAI programs to remediate a randomly selected group of students. Results for two
independent samples on a standardized test are listed in a table below. At the 0.05 level of significance, use the
Wilcoxon rank-sum test to test the hypothesis that the sample results are from populations with equal medians. Program I Program II 60756163 66896877 86696470 84808187 728259 78739193 9495
(Essay)
4.8/5 (32)
Test the sequence of digits below for randomness above and below the value of 4.5. 0 4 7 3 6 0 9 7 4 8 7 2 8 5 7 3 9 6 4 6 4 7 9 1 6 1 9 5 8 3 7 8 5 7 3 5 2 9 3 8
(Essay)
4.9/5 (45)
SAT scores for students selected randomly from three different schools are shown below. Use a significance
level of 0.05 to test the claim that the students from the three schools had the same median SAT score. 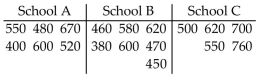
(Essay)
4.8/5 (32)
Use the sign test to test the indicated claim. The waiting times (in minutes) of 28 randomly selected customers in
a bank are given below. Use a significance level of 0.05 to test the claim that the population median is equal to
5.3 minutes. 8.2 8.0 10.5 3.8 6.4 5.3 7.8 2.9 6.0 7.7 6.1 5.9 1.2 10.4 7.3 6.9 5.8 5.1 6.2 3.1 5.8 11.7 4.5 6.5 9.8 7.4 2.3 7.8
(Essay)
4.8/5 (42)
Use the Wilcoxon rank-sum approach to test the claim that the two independent sample student grade averages at
two colleges come from populations with equal medians. The sample data is listed below. Use a 0.05 level of significance,
and assume that the samples were randomly selected. College A 3.2 4.0 2.4 2.6 2.0 1.8 1.3 0.0 0.5 1.4 2.9 College B 2.4 1.9 0.3 0.8 2.8 3.0 3.1 3.1 3.1 3.5 3.5
(Essay)
4.8/5 (33)
Filters
- Essay(0)
- Multiple Choice(0)
- Short Answer(0)
- True False(0)
- Matching(0)