Exam 14: Statistical Process Control
Exam 1: Introduction to Statistics155 Questions
Exam 2: Exploring Data With Tables and Graphs132 Questions
Exam 3: Describing, Exploring, and Comparing Data225 Questions
Exam 4: Probability219 Questions
Exam 5: Discrete Probability Distributions205 Questions
Exam 6: Normal Probability Distributions254 Questions
Exam 7: Estimating Parameters and Determining Sample Sizes170 Questions
Exam 8: Hypothesis Testing187 Questions
Exam 9: Inferences From Two Samples192 Questions
Exam 10: Correlation and Regression174 Questions
Exam 11: Goodness-Of-Fit and Contingency Tables100 Questions
Exam 12: Analysis of Variance113 Questions
Exam 13: Nonparametric Tests121 Questions
Exam 14: Statistical Process Control90 Questions
Select questions type
Examine the given run chart or control chart and determine whether the process is within statistical control. 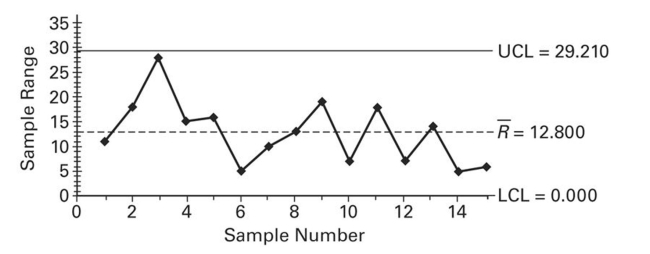
Free
(Multiple Choice)
4.7/5  (35)
(35)
Correct Answer: Verified
A
Which type of chart does not have control limits?
Free
(Multiple Choice)
4.9/5 (37)
Correct Answer:Verified
D
A machine is supposed to fill boxes to a weight of 50 pounds. Every 30 minutes a sample of four boxes is tested;
the results are given below. 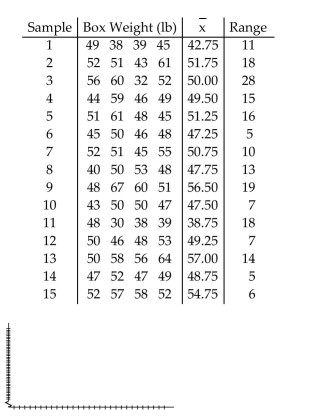
Free
(Essay)
4.7/5 (34)
Correct Answer:Verified
 Construct an R chart and determine whether the process variation is within statistical control.
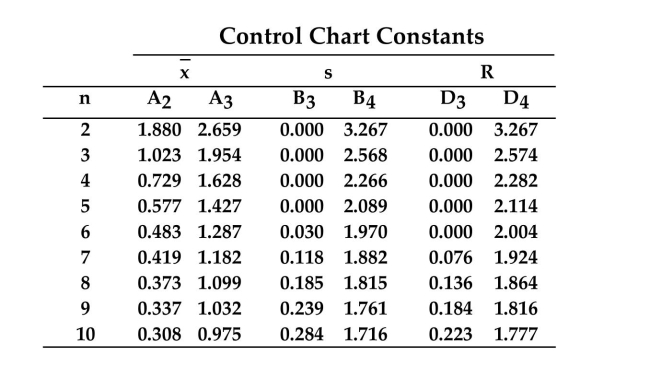
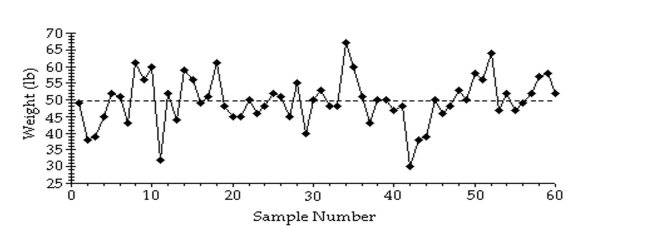
A run chart for individual values is shown below. Does there appear to be a pattern suggesting that the process
is not within statistical control? If so, describe the pattern. 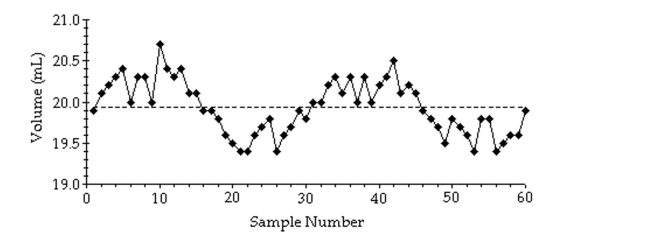
(Essay)
4.9/5 (39)
Sketch a control chart that indicates that a process is not statistically stable due to the run of 8 rule.
(Essay)
4.9/5 (45)
Which of the following is not one of the criteria for determining if a control chart indicates that a process is not statistically stable?
(Multiple Choice)
4.7/5 (42)
Construct an R chart and determine whether the process variation is within statistical control. 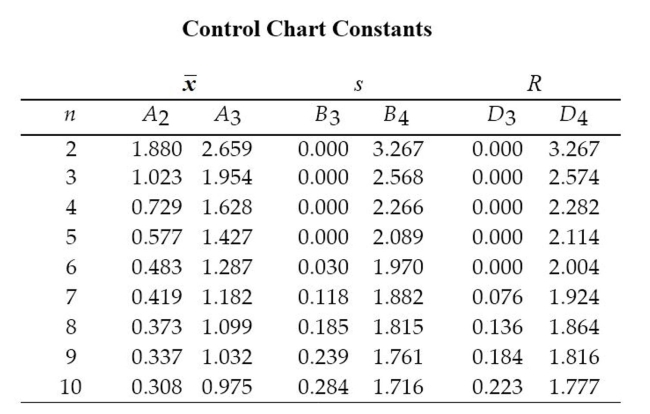 A machine that is supposed to fill small bottles to contain 20 milliliters yields the following data from a test of 4 bottles
every hour.
A machine that is supposed to fill small bottles to contain 20 milliliters yields the following data from a test of 4 bottles
every hour. 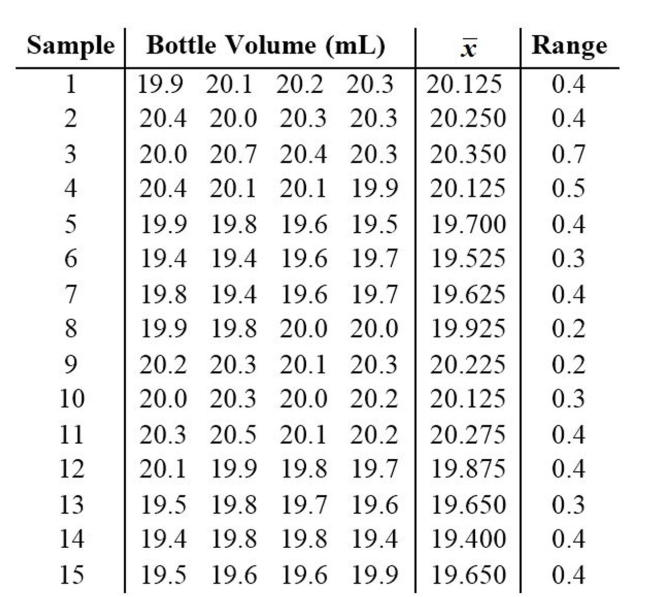
(Essay)
4.7/5 (36)
Describe an R chart and give an example. What does it attempt to monitor?
(Essay)
4.8/5 (42)
A control chart for is shown below. Determine whether the process mean is within statistical control. If it is not, identify which of the three out-of-control criteria lead to rejection of a statistically stable mean.
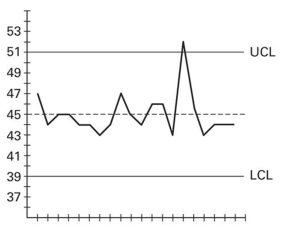
(Essay)
4.9/5 (34)
A machine that is supposed to fill small bottles to contain 20 milliliters yields the following data from a test of 4
bottles every hour. 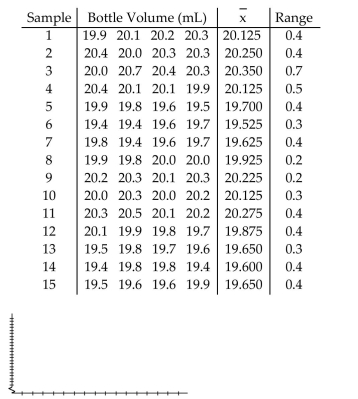
(Essay)
4.9/5 (39)
A machine is supposed to fill boxes to a weight of 50 pounds. Every 30 minutes a sample of four boxes is tested; the results are given below.
What would be the value of the centerline that would be used in creating an R chart? 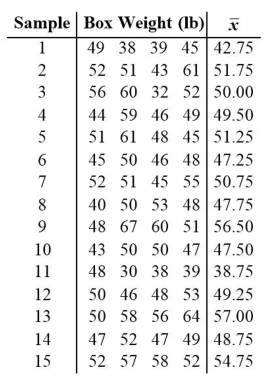
(Multiple Choice)
4.8/5 (33)
A control chart for attributes is to be constructed. Which process would have wider control limits, a process
which has been having a 5% rate of nonconforming items, or a process which has been having a 10% of
nonconforming items? Assume that both processes have the same sample sizes. For a given sample size, would
it be easier to detect a shift from 5% to 10% or a shift from 10% to 15%? Explain your reasoning.
(Essay)
4.9/5 (39)
Describe the three criteria used to determine if a control chart indicates a process which is not statistically stable.
(Essay)
4.8/5 (41)
Construct an chart and determine whether the process variation is within statistical control. 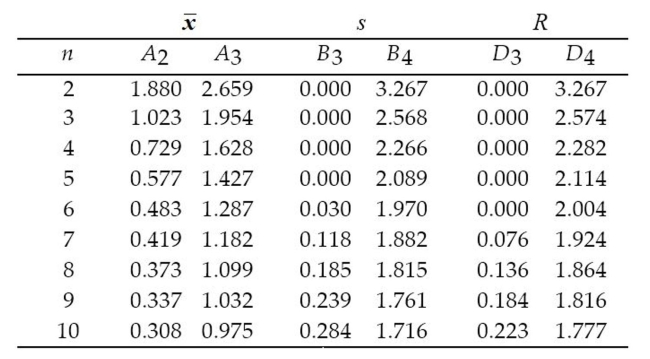 A machine that is supposed to produce ball bearings with a diameter of 7 millimeters yields the following data
from a test of 5 ball bearings every 20 minutes.
A machine that is supposed to produce ball bearings with a diameter of 7 millimeters yields the following data
from a test of 5 ball bearings every 20 minutes. 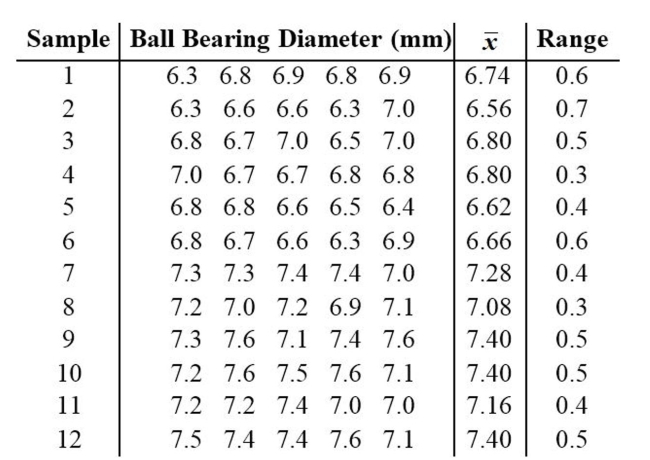
(Essay)
4.9/5 (41)
A control chart for is shown below. Determine whether the process mean is within statistical control. If it is
not, identify which of the three out-of-control criteria lead to rejection of a statistically stable mean. 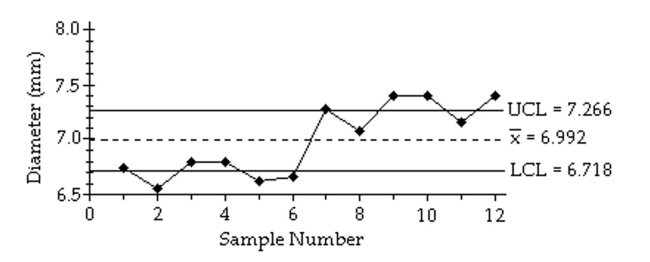
(Essay)
4.8/5 (37)
A control chart for R is shown below. Determine whether the process variation is within statistical control. If it
is not, identify which of the three out-of-control criteria lead to rejection of statistically stable variation. 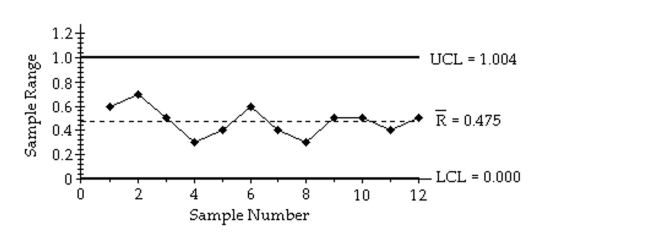
(Essay)
5.0/5 (36)
A run chart for individual values is shown below. Does there appear to be a pattern suggesting that the process
is not within statistical control? If so, describe the pattern. 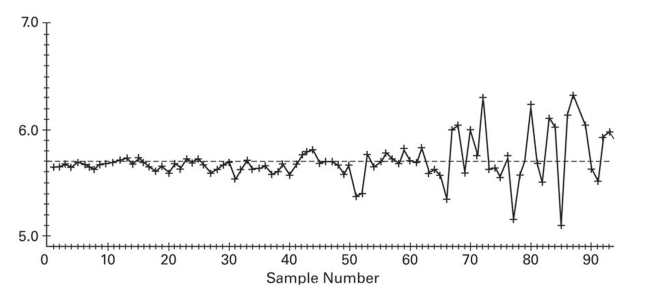
(Essay)
4.8/5 (33)
An x chart based on standard deviations (instead of ranges) is made by plotting sample means with a centerline
at x and control limits at x + A3 s and x - A3 s where A3 is found in the Control Chart Constants table and s is
the mean of the sample standard deviations. Construct an x chart based on standard deviations for the data
below.
A manufacturer of high intensity video projector lightbulbs picks 6 lightbulbs at random each day for quality
control. The mean, standard deviation, and range (in hours) of the lifetimes of the 6 lightbulbs are calculated.
The results for 12 consecutive days are shown in the table below. Day Range 1 21.1 3.4 1.2 2 23.4 4.7 1.7 3 20.9 3.1 0.9 4 25.6 6.2 2.3 5 21.3 4.7 1.3 6 20.5 3.7 1.7 7 25.8 5.8 2.1 8 23.7 6.2 2.9 9 29.8 2.1 0.8 10 22.7 4.4 1.6 11 20.0 2.7 0.7 12 24.6 7.8 3.0
(Essay)
4.7/5 (41)
A machine is supposed to fill boxes to a weight of 50 pounds. Every 30 minutes a sample of four boxes is tested;
the results are given below. 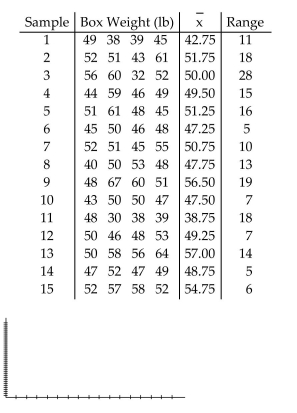
(Essay)
4.9/5 (36)
Filters
- Essay(0)
- Multiple Choice(0)
- Short Answer(0)
- True False(0)
- Matching(0)