Exam 15: Multiple Regression
Exam 1: Data and Decisions41 Questions
Exam 2: Displaying and Describing Categorical Data45 Questions
Exam 3: Displaying and Describing Quantitative Data32 Questions
Exam 4: Correlation and Linear Regression84 Questions
Exam 5: Randomness and Probability34 Questions
Exam 6: Random Variables and Probability Models28 Questions
Exam 7: The Normal and Other Continuous Distributions31 Questions
Exam 8: Surveys and Sampling30 Questions
Exam 9: Sampling Distributions and Confidence Intervals for Proportions66 Questions
Exam 10: Testing Hypotheses About Proportions27 Questions
Exam 11: Confidence Intervals and Hypothesis Tests for Means28 Questions
Exam 12: Comparing Two Means35 Questions
Exam 13: Inference for Counts: Chi-Square Tests68 Questions
Exam 14: Inference for Regression38 Questions
Exam 15: Multiple Regression36 Questions
Exam 16: Introduction to Data Mining68 Questions
Select questions type
Use the following information for problems
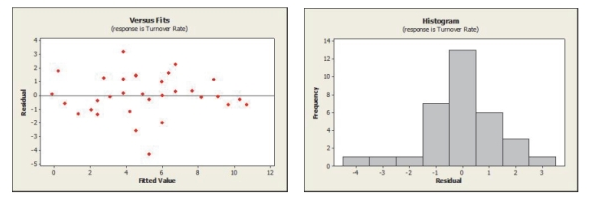
To determine what affects turnover rate, a sample of 33 companies was randomly selected and data collected on the average annual bonus and turnover rate (%). In addition, a questionnaire was administered to the employees of each company to arrive at a trust index (measured on a scale of 0 - 100). Below are the multiple regression results. Dependent Variable is Turnover Rate
Predictor Coef SE Coef T P Constant 12.1005 0.7826 15.46 0.000 Trust Index -0.07149 0.01966 -3.64 0.001 Average Bonus -0.0007216 0.0001481 -4.87 0.000
Analysis of Variance
Source DF SS MS Regression 2 262.73 131.36 Residual Error 30 67.27 2.24 Total 32 330.00
 -Write out the estimated regression equation.
(Essay)
4.9/5  (33)
(33)
A sample of 33 companies was randomly selected and data collected on the average annual bonus, turnover rate (%), and trust index (measured on a scale of 0 - 100).
The regression coefficient associated with Average Bonus was found to be -0.0007216. The correct interpretation of this value is
(Multiple Choice)
4.8/5 (34)
Selling price and amount spent advertising were entered into a multiple regression to determine what affects flat panel LCD TV sales. The plot of residuals versus Predicted values is shown below. What does the residual plot suggest? 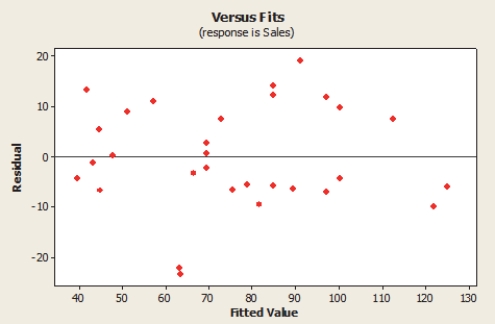
(Multiple Choice)
5.0/5 (45)
A sample of 33 companies was randomly selected and data collected on the average annual bonus, turnover rate (%), and trust index (measured on a scale of 0 - 100).
Using the output below, and a significance level of α = .01, we can conclude that Dependent Variable is Turnover Rate
Predictor Coef SE Coef T P Constant 12.1005 0.7826 15.46 0.000 Trust Index -0.07149 0.01966 -3.64 0.001 Average Bonus -0.0007216 0.0001481 -4.87 0.000
Analysis of Variance
Source DF SS MS Regression 2 262.73 131.36 Residual Error 30 67.27 2.24 Total 32 330.00
(Multiple Choice)
4.9/5 (36)
A sample of 33 companies was randomly selected and data collected on the average annual bonus, turnover rate (%), and trust index (measured on a scale of 0 - 100). According to the output is shown below, what is the estimated multiple regression Model?
Dependent Variable is Turnover Rate
Predictor Coef SE Coef T P Constant 12.1005 0.7826 15.46 0.000 Trust Index -0.07149 0.01966 -3.64 0.001 Average Bonus -0.0007216 0.0001481 -4.87 0.000
(Multiple Choice)
4.9/5 (41)
Use the following information for problems
Sales figures (number of units), selling price and amount spent on advertising (as a percentage of total advertising expenditure in the previous quarter) for the popular Sony Bravia Television were obtained for last quarter from a sample of 30 different stores. The results of a multiple regression are presented below. Dependent Variable Sales
Predictor Coef sE Coef T P Constant 90.19 25.08 3.60 0.001 Price =0.03055 0.01005 -3.04 0.005 Advertising 3.0926 0.3680 8.40 0.000
Analyaia of Variance
Source DF SS MS Regresgion 2 16477.3 8238.7 Residual Error 27 3038.0 112.5 Total 29 19515.4
 -Report the adjusted R2 for this model. Write a sentence interpreting this value.
(Essay)
4.7/5 (26)
Use the output to describe the relationship between sales figures, selling price and
amount spent on advertising for the Sony Bravia. In 2-3 sentences, summarize the
results of the multiple regression.
(Essay)
4.8/5 (45)
A sample of 33 companies was randomly selected and data collected on the average annual bonus, turnover rate (%), and trust index (measured on a scale of 0 - 100).
Based on the output, how much of the variability in Turnover Rate is explained by the
Estimated multiple regression model? Dependent Variable is Turnover Rate Predictor Coef SE Coef T P Constant 12.1005 0.7826 15.46 0.000 Trust Index -0.07149 0.01966 -3.64 0.001 Average Bonus -0.0007216 0.0001481 -4.87 0.000
(Multiple Choice)
4.8/5 (38)
Use the following information for problems
To determine what affects turnover rate, a sample of 33 companies was randomly selected and data collected on the average annual bonus and turnover rate (%). In addition, a questionnaire was administered to the employees of each company to arrive at a trust index (measured on a scale of 0 - 100). Below are the multiple regression results. Dependent Variable is Turnover Rate
Predictor Coef SE Coef T P Constant 12.1005 0.7826 15.46 0.000 Trust Index -0.07149 0.01966 -3.64 0.001 Average Bonus -0.0007216 0.0001481 -4.87 0.000
Analysis of Variance
Source DF SS MS Regression 2 262.73 131.36 Residual Error 30 67.27 2.24 Total 32 330.00
-State the hypotheses for testing the regression coefficient of Average Annual Bonus.
Based on the results, what do you conclude?
(Essay)
4.9/5 (44)
Use the following information for problems
Sales figures (number of units), selling price and amount spent on advertising (as a percentage of total advertising expenditure in the previous quarter) for the popular Sony Bravia Television were obtained for last quarter from a sample of 30 different stores. The results of a multiple regression are presented below. Dependent Variable Sales
Predictor Coef sE Coef T P Constant 90.19 25.08 3.60 0.001 Price =0.03055 0.01005 -3.04 0.005 Advertising 3.0926 0.3680 8.40 0.000
Analyaia of Variance
Source DF SS MS Regresgion 2 16477.3 8238.7 Residual Error 27 3038.0 112.5 Total 29 19515.4
-Write out the estimated regression equation.
(Essay)
5.0/5 (40)
Selling price and amount spent advertising were entered into a multiple regression to determine what affects flat panel LCD TV sales. Using the output below, estimate
The number of units sold on average at a store that sells the Sony Bravia for $2199
And spends 10% of its advertising budget on the product. Dependent Variable is Sales Predictor Coef SE Coef T P Constant 90.19 25.08 3.60 0.001 Price -0.03055 0.01005 -3.04 0.005 Advertising 3.0926 0.3680 8.40 0.000
(Multiple Choice)
4.9/5 (39)
Use the following information for problems
To determine what affects turnover rate, a sample of 33 companies was randomly selected and data collected on the average annual bonus and turnover rate (%). In addition, a questionnaire was administered to the employees of each company to arrive at a trust index (measured on a scale of 0 - 100). Below are the multiple regression results. Dependent Variable is Turnover Rate
Predictor Coef SE Coef T P Constant 12.1005 0.7826 15.46 0.000 Trust Index -0.07149 0.01966 -3.64 0.001 Average Bonus -0.0007216 0.0001481 -4.87 0.000
Analysis of Variance
Source DF SS MS Regression 2 262.73 131.36 Residual Error 30 67.27 2.24 Total 32 330.00
-Using this model, the turnover rate for a company with a trust index score of 70 and
an average annual bonus of $6500 is predicted to be 2.41%. If the company observes
a turnover rate of 2.15%, what is the value of the residual for this company? What
does the value of the residual tell you about the prediction?
(Essay)
4.7/5 (39)
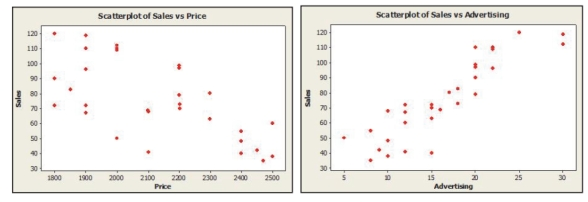
Selling price and amount spent advertising were entered into a multiple regression to determine what affects flat panel LCD TV sales. If the scatterplots of sales versus
Both selling price and amount spent on advertising are created, they are being used to
Determine whether
(Multiple Choice)
4.9/5 (38)
Use the following information for problems
To determine what affects turnover rate, a sample of 33 companies was randomly selected and data collected on the average annual bonus and turnover rate (%). In addition, a questionnaire was administered to the employees of each company to arrive at a trust index (measured on a scale of 0 - 100). Below are the multiple regression results. Dependent Variable is Turnover Rate
Predictor Coef SE Coef T P Constant 12.1005 0.7826 15.46 0.000 Trust Index -0.07149 0.01966 -3.64 0.001 Average Bonus -0.0007216 0.0001481 -4.87 0.000
Analysis of Variance
Source DF SS MS Regression 2 262.73 131.36 Residual Error 30 67.27 2.24 Total 32 330.00
-Is the regression equation significant overall? Explain.
(Essay)
4.8/5 (38)
Use the following information for problems
Sales figures (number of units), selling price and amount spent on advertising (as a percentage of total advertising expenditure in the previous quarter) for the popular Sony Bravia Television were obtained for last quarter from a sample of 30 different stores. The results of a multiple regression are presented below. Dependent Variable Sales
Predictor Coef sE Coef T P Constant 90.19 25.08 3.60 0.001 Price =0.03055 0.01005 -3.04 0.005 Advertising 3.0926 0.3680 8.40 0.000
Analyaia of Variance
Source DF SS MS Regresgion 2 16477.3 8238.7 Residual Error 27 3038.0 112.5 Total 29 19515.4
-Predict the sales for a store that sells the Sony Bravia for $2199 and spends 10% of its
advertising budget on the product.
(Essay)
4.8/5 (47)
Use the following information for problems
Sales figures (number of units), selling price and amount spent on advertising (as a percentage of total advertising expenditure in the previous quarter) for the popular Sony Bravia Television were obtained for last quarter from a sample of 30 different stores. The results of a multiple regression are presented below. Dependent Variable Sales
Predictor Coef sE Coef T P Constant 90.19 25.08 3.60 0.001 Price =0.03055 0.01005 -3.04 0.005 Advertising 3.0926 0.3680 8.40 0.000
Analyaia of Variance
Source DF SS MS Regresgion 2 16477.3 8238.7 Residual Error 27 3038.0 112.5 Total 29 19515.4
-State the hypotheses for testing the regression coefficient of Price. Based on the
results, what do you conclude?
(Essay)
4.8/5 (43)
Filters
- Essay(0)
- Multiple Choice(0)
- Short Answer(0)
- True False(0)
- Matching(0)