Exam 9: Sampling Distributions and Confidence Intervals for Proportions
Exam 1: Data and Decisions41 Questions
Exam 2: Displaying and Describing Categorical Data45 Questions
Exam 3: Displaying and Describing Quantitative Data32 Questions
Exam 4: Correlation and Linear Regression84 Questions
Exam 5: Randomness and Probability34 Questions
Exam 6: Random Variables and Probability Models28 Questions
Exam 7: The Normal and Other Continuous Distributions31 Questions
Exam 8: Surveys and Sampling30 Questions
Exam 9: Sampling Distributions and Confidence Intervals for Proportions66 Questions
Exam 10: Testing Hypotheses About Proportions27 Questions
Exam 11: Confidence Intervals and Hypothesis Tests for Means28 Questions
Exam 12: Comparing Two Means35 Questions
Exam 13: Inference for Counts: Chi-Square Tests68 Questions
Exam 14: Inference for Regression38 Questions
Exam 15: Multiple Regression36 Questions
Exam 16: Introduction to Data Mining68 Questions
Select questions type
One division of a large defense contractor manufactures telecommunication equipment for the military. This division reports that 12% of non-electrical components
Are reworked. Management wants to determine if this percentage is the same as the
Percentage rework for the company's electrical components. The Quality Control
Department plans to check a random sample of the over 10,000 electrical components
Manufactured across all divisions. The 95% confidence interval based on this data is
)0758 to .1339. Should management conclude that the percentage of rework for
Electrical components is lower than the rate of 12% for non-electrical components?
(Multiple Choice)
4.8/5  (29)
(29)
In a metal fabrication process, metal rods are produced to a specified target length of
15 feet. Suppose that the lengths are normally distributed. A quality control specialist
collects a random sample of 16 rods and finds the sample mean length to be 14.8 feet and
a standard deviation of 0.65 feet.
A. Describe the sampling distribution for the sample mean.
b. What is the standard error?
c. For 95% confidence, what is the margin of error?
d. Based on the sample results, create the 95% confidence interval and interpret.
(Essay)
4.8/5 (37)
Assume that a set of test scores in an Introduction to Finance class is normally distributed with a mean of 72 and a standard deviation of 8. Use the 68-95-99.7 rule to
Find the percentage of scores less than 56.
(Multiple Choice)
4.8/5 (34)
Suppose the time it takes for a purchasing agent to complete an online ordering process is normally distributed with a mean of 8 minutes and a standard deviation of 2
Minutes. What is the probability that it takes longer than 11 minutes for the purchasing
Agent to complete the process?
(Multiple Choice)
4.8/5 (31)
After the financial crisis of 2007/2008, the Dow Jones Industrial Average (DJIA) improved from a low of 7278 on March 20, 2009, to new records just a few years later.
On August 8, 2011, the Dow dropped 634.8 points. A histogram of day-to-day changes in
The DJIA looked like the histogram below. An accurate description of the distribution of
Changes in the DJIA is 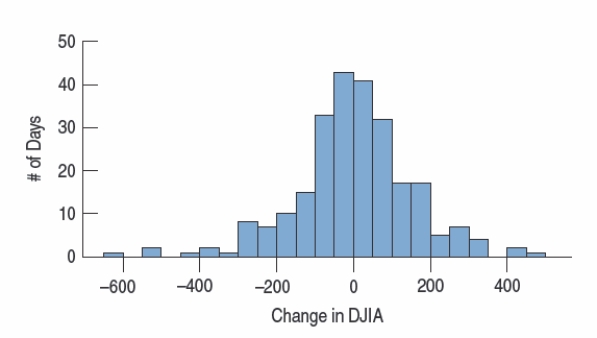
(Multiple Choice)
4.7/5 (36)
All else being equal, decreasing the level of confidence desired will
(Multiple Choice)
4.8/5 (36)
EU (European Union) countries report that 46% of their labor force is female. The United Nations wants to determine if the percentage of females in the U.S. labor force is
The same. Based on a sample of 500 employment records, representatives from the
United States Department of Labor find that the 95% confidence interval for the
Proportion of females in the U.S. labor force is .357 to .443. If the Department of Labor
Wishes to tighten its interval, they should
(Multiple Choice)
4.9/5 (35)
Which is true about a 90% confidence interval based on a given sample? I. The interval contains 90% of the population.
II) Results from 90% of all samples will lie in this interval.
III) The interval is smaller than a 95% confidence interval would be.
(Multiple Choice)
4.8/5 (31)
In a recent poll of 200 households, it was found that 152 had at least one computer and one television. A 95% confidence interval to estimate the population proportion was
Calculated to be 0.701 to 0.819. What sample size would be needed to change the margin
Of error to 0.030?
(Multiple Choice)
4.8/5 (39)
A government agency has 6000 employees. As an alternative to the traditional five day work week, employees were asked whether they preferred a four day work week (10
Hours per day) or flexible hours. The table below shows the results by age category.
Which of the following statements is true about work week preferences and age
Category? Age Category Prefers 4 Day Week Prefers Flex Hours Under 30 600 300 30-45 1200 1500 Over 45 2100 300
(Multiple Choice)
4.9/5 (30)
A Normal model states that if we draw repeated random samples of the same size, n, from some population and measure sample proportions, then the collection of these
Proportions will pile up around the underlying population proportion, p. The requirement
For this to work is
(Multiple Choice)
5.0/5 (35)
Suppose the time it takes for a purchasing agent to complete an online ordering process is normally distributed with a mean of 8 minutes and a standard deviation of 2
Minutes. Suppose a random sample of 25 ordering processes is selected. The standard
Deviation of the sampling distribution of mean times is
(Multiple Choice)
4.8/5 (30)
An advocacy group is investigating whether gender has an effect on job category in large investment firms. She surveyed a sample of firms with the following results: Job Category Male Female Clerical / Technical 85 215 Professional Staff 720 480 Executive / Managerial 400 100 What is the probability that a randomly selected employee's job category is executive /
Managerial given that she is female?
(Multiple Choice)
4.8/5 (36)
Insurance company records indicate that 10% of its policyholders file claims involving theft or robbery of personal property from their homes. Suppose a random sample of 400
Policyholders is selected. The standard deviation of the sampling distribution of the
Sample proportion of policyholders filing claims involving theft or robbery from their
Homes is
(Multiple Choice)
4.8/5 (31)
In a particular production process, drying times for newly pained parts are uniformly distributed between 2 and 8 minutes. The probability that a part dries in less than 6
Minutes is
(Multiple Choice)
4.9/5 (31)
A Normal probability plot of the weights of individuals signed up for a popular diet program is shown below. The best description of the plot is 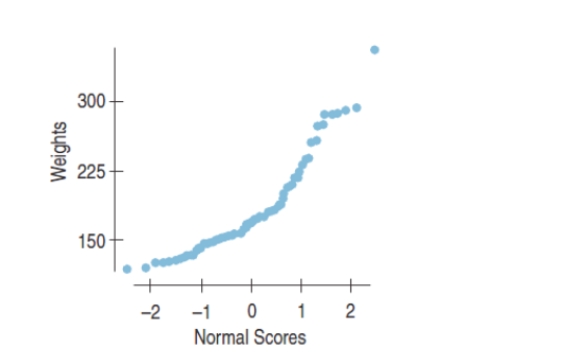
(Multiple Choice)
4.8/5 (38)
An advocacy group is investigating whether gender has an effect on job category in large investment firms. Given the results shown in the table below, which of the
Following statements is true about gender and job category? Job Category Male Female Clerical / Technical 85 215 Professional Staff 720 480 Executive / Managerial 400 100
(Multiple Choice)
4.8/5 (39)
A researcher is conducting a study on eating disorders. Using a list of recent participants in the online Weight Watchers program, she randomly selects a sample from
The alphabetized list. This list represents the
(Multiple Choice)
4.8/5 (29)
Insurance companies track life expectancy information to assist in determining the
cost of life insurance policies. Last year the average life expectancy of all policyholders
was 77 years. ABI Insurance wants to determine if their clients now have a longer life
expectancy, on average, so they randomly sample some of their recently paid policies.
The ages of the clients in the sample are shown below. 86 75 83 84 81 77 78 79 79 81 76 85 70 76 79 81 73 74 72 83
A. Based on the sample results, find the 90% confidence interval and interpret.
b. For more accurate cost determination, ABI Insurance wants to estimate the average life
expectancy to within one year with 95% confidence. How many randomly selected
recently paid policies would they need to sample?
c. Suppose ABI samples 100 recently paid policies. This sample yields a mean of 77.7
years and a standard deviation of 3.6 years. Find a 90% confidence interval and interpret.
(Essay)
4.7/5 (30)
A recent poll of 120 adults who frequent the local farmer's market found that 54 have purchased reusable cloth bags for their groceries. The 95% confidence interval for the
Proportion of adults who have purchased reusable cloth bags is
(Multiple Choice)
4.9/5 (34)
Filters
- Essay(0)
- Multiple Choice(0)
- Short Answer(0)
- True False(0)
- Matching(0)