Exam 12: Chi-Square Tests and Nonparametric Tests
Exam 1: Introduction145 Questions
Exam 2: Organizing and Visualizing Data210 Questions
Exam 3: Numerical Descriptive Measures153 Questions
Exam 4: Basic Probability171 Questions
Exam 5: Discrete Probability Distributions218 Questions
Exam 6: The Normal Distribution and Other Continuous Distributions191 Questions
Exam 7: Sampling and Sampling Distributions197 Questions
Exam 8: Confidence Interval Estimation196 Questions
Exam 9: Fundamentals of Hypothesis Testing: One-Sample Tests165 Questions
Exam 10: Two-Sample Tests210 Questions
Exam 11: Analysis of Variance213 Questions
Exam 12: Chi-Square Tests and Nonparametric Tests201 Questions
Exam 13: Simple Linear Regression213 Questions
Exam 14: Introduction to Multiple Regression355 Questions
Exam 15: Multiple Regression Model Building96 Questions
Exam 16: Time-Series Forecasting168 Questions
Exam 17: Statistical Applications in Quality Management133 Questions
Exam 18: A Roadmap for Analyzing Data54 Questions
Exam 19: Questions that Involve Online Topics321 Questions
Select questions type
TABLE 12-5
Four surgical procedures currently are used to install pacemakers. If the patient does not need to return for follow-up surgery, the operation is called a "clear" operation. A heart center wants to compare the proportion of clear operations for the 4 procedures and collects the following numbers of patients from their own records:
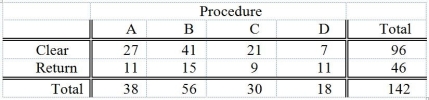 They will use this information to test for a difference among the proportion of clear operations using a chi-square test with a level of significance of 0.05.
-Referring to Table 12-5, there is sufficient evidence to conclude that the proportions between procedure B and procedure C are different at a 0.05 level of significance.
They will use this information to test for a difference among the proportion of clear operations using a chi-square test with a level of significance of 0.05.
-Referring to Table 12-5, there is sufficient evidence to conclude that the proportions between procedure B and procedure C are different at a 0.05 level of significance.
Free
(True/False)
4.8/5  (34)
(34)
Correct Answer: Verified
False
TABLE 12-5
Four surgical procedures currently are used to install pacemakers. If the patient does not need to return for follow-up surgery, the operation is called a "clear" operation. A heart center wants to compare the proportion of clear operations for the 4 procedures and collects the following numbers of patients from their own records:
They will use this information to test for a difference among the proportion of clear operations using a chi-square test with a level of significance of 0.05.
-Referring to Table 12-5, there is sufficient evidence to conclude that the proportions between procedure A and procedure D are different at a 0.05 level of significance.
Free
(True/False)
4.9/5 (36)
Correct Answer:Verified
False
To use the Wilcoxon rank sum test as a test for location, you must assume that
Free
(Multiple Choice)
4.8/5 (29)
Correct Answer:Verified
D
TABLE 12-11
The director of admissions at a state college is interested in seeing if admissions status (admitted, waiting list, denied admission) at his college is independent of the type of community in which an applicant resides. He takes a sample of recent admissions decisions and forms the following table:
 He will use this table to do a chi-square test of independence with a level of significance of 0.01.
-Referring to Table 12-11, the decision made suggests that admissions status at the college is independent of the type of community in which an applicant resides.
He will use this table to do a chi-square test of independence with a level of significance of 0.01.
-Referring to Table 12-11, the decision made suggests that admissions status at the college is independent of the type of community in which an applicant resides.
(True/False)
4.9/5 (43)
If we use the chi-square method of analysis to test for the difference between proportions, we must assume that there are at least 5 observed frequencies in each cell of the contingency table.
(True/False)
4.7/5 (33)
The Journal of Business Venturing reported on the activities of entrepreneurs during the organization creation process. As part of a designed study, a total of 71 entrepreneurs were interviewed and divided into 3 groups: those that were successful in founding a new firm (n₁ = 34), those still actively trying to establish a firm (n₂ = 21), and those who tried to start a new firm but eventually gave up (n₃ = 16). The total number of activities undertaken (e.g., developed a business plan, sought funding, looked for facilities) by each group over a specified time period during organization creation was measured. The objective was to compare the mean number of activities of the 3 groups of entrepreneurs. Because of concerns over necessary assumption of the parametric analysis, it was decided to use a nonparametric analysis. Identify the nonparametric method that would be used to analyze the data.
(Multiple Choice)
4.8/5 (49)
TABLE 12-13
Recent studies have found that American children are more obese than in the past. The amount of time children spent watching television has received much of the blame. A survey of 100 ten-year-olds revealed the following with regards to weights and average number of hours a day spent watching television. We are interested in testing whether the mean number of hours spent watching TV and weights are independent at 1% level of significance.
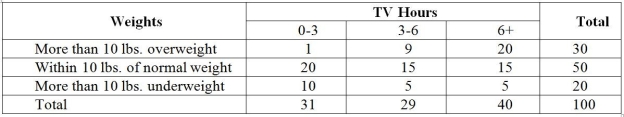 -Referring to Table 12-13, if there is no connection between weights and average number of hours spent watching TV, we should expect how many children to be spending no more than 6 hours on average watching TV and are more than 10 lbs. underweight?
(Multiple Choice)
4.9/5 (33)
TABLE 12-2
The dean of a college is interested in the proportion of graduates from his college who have a job offer on graduation day. He is particularly interested in seeing if there is a difference in this proportion for accounting and economics majors. In a random sample of 100 of each type of major at graduation, he found that 65 accounting majors and 52 economics majors had job offers. If the accounting majors are designated as "Group 1" and the economics majors are designated as "Group 2," perform the appropriate hypothesis test using a level of significance of 0.05.
-Referring to Table 12-2, the same decision would be made with this test if the level of significance had been 0.01 rather than 0.05.
(True/False)
4.9/5 (29)
TABLE 12-12
Parents complain that children read too few storybooks and watch too much television nowadays. A survey of 1,000 children reveals the following information on average time spent watching TV and average time spent reading storybooks.
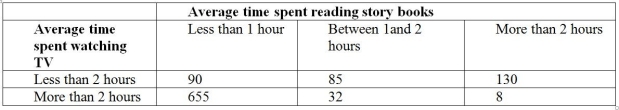 -Referring to Table 12-12, if the null hypothesis of no connection between time spent watching TV and time spent reading storybooks is true, how many children watching less than 2 hours of TV and reading no more than 2 hours of storybooks on average can we expect?
(Multiple Choice)
4.8/5 (41)
TABLE 12-15
The director of the MBA program of a state university wanted to know if a one week orientation would change the proportion among potential incoming students who would perceive the program as being good. Given below is the result from 215 students' view of the program before and after the orientation.
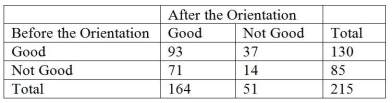 -Referring to Table 12-15, what should be the director's conclusion?
(Multiple Choice)
4.9/5 (37)
TABLE 12-6
According to an article in Marketing News, fewer checks are being written at the grocery store checkout than in the past. To determine whether there is a difference in the proportion of shoppers who pay by check among three consecutive years at a 0.05 level of significance, the results of a survey of 500 shoppers in three consecutive years are obtained and presented below.
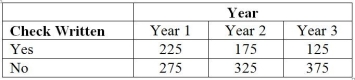 -Referring to Table 12-6, what is the value of the test statistic?
(Short Answer)
4.9/5 (37)
TABLE 12-2
The dean of a college is interested in the proportion of graduates from his college who have a job offer on graduation day. He is particularly interested in seeing if there is a difference in this proportion for accounting and economics majors. In a random sample of 100 of each type of major at graduation, he found that 65 accounting majors and 52 economics majors had job offers. If the accounting majors are designated as "Group 1" and the economics majors are designated as "Group 2," perform the appropriate hypothesis test using a level of significance of 0.05.
-Referring to Table 12-2, the null hypothesis should be rejected.
(True/False)
4.9/5 (38)
TABLE 12-5
Four surgical procedures currently are used to install pacemakers. If the patient does not need to return for follow-up surgery, the operation is called a "clear" operation. A heart center wants to compare the proportion of clear operations for the 4 procedures and collects the following numbers of patients from their own records:
They will use this information to test for a difference among the proportion of clear operations using a chi-square test with a level of significance of 0.05.
-Referring to Table 12-5, there is sufficient evidence to conclude that the proportions between procedure A and procedure C are different at a 0.05 level of significance.
(True/False)
4.8/5 (34)
TABLE 12-16
A filling machine at a local soft drinks company is calibrated to fill the cans at a mean amount of 12 fluid ounces and a standard deviation of 0.5 ounces. The company wants to test whether the standard deviation of the amount filled by the machine is 0.5 ounces. A random sample of 15 cans filled by the machine reveals a standard deviation of 0.67 ounces.
-Referring to Table 12-16, what is the value of the test statistic?
(Short Answer)
4.9/5 (34)
TABLE 12-5
Four surgical procedures currently are used to install pacemakers. If the patient does not need to return for follow-up surgery, the operation is called a "clear" operation. A heart center wants to compare the proportion of clear operations for the 4 procedures and collects the following numbers of patients from their own records:
They will use this information to test for a difference among the proportion of clear operations using a chi-square test with a level of significance of 0.05.
-Referring to Table 12-5, the expected cell frequency for the Procedure D/Return cell is ________.
(Short Answer)
4.7/5 (36)
The squared difference between the observed and theoretical frequencies should be large if there is no significant difference between the proportions.
(True/False)
4.9/5 (38)
TABLE 12-11
The director of admissions at a state college is interested in seeing if admissions status (admitted, waiting list, denied admission) at his college is independent of the type of community in which an applicant resides. He takes a sample of recent admissions decisions and forms the following table:
He will use this table to do a chi-square test of independence with a level of significance of 0.01.
-Referring to Table 12-11, the same decision would be made with this test if the level of significance had been 0.05.
(True/False)
4.9/5 (33)
TABLE 12-5
Four surgical procedures currently are used to install pacemakers. If the patient does not need to return for follow-up surgery, the operation is called a "clear" operation. A heart center wants to compare the proportion of clear operations for the 4 procedures and collects the following numbers of patients from their own records:
They will use this information to test for a difference among the proportion of clear operations using a chi-square test with a level of significance of 0.05.
-Referring to Table 12-5, there is sufficient evidence to conclude that the proportions between procedure A and procedure B are different at a 0.05 level of significance.
(True/False)
4.8/5 (34)
TABLE 12-15
The director of the MBA program of a state university wanted to know if a one week orientation would change the proportion among potential incoming students who would perceive the program as being good. Given below is the result from 215 students' view of the program before and after the orientation.
-Referring to Table 12-15, the director should reject the null hypothesis using a 1% level of significance.
(True/False)
4.7/5 (28)
TABLE 12-13
Recent studies have found that American children are more obese than in the past. The amount of time children spent watching television has received much of the blame. A survey of 100 ten-year-olds revealed the following with regards to weights and average number of hours a day spent watching television. We are interested in testing whether the mean number of hours spent watching TV and weights are independent at 1% level of significance.
-Referring to Table 12-13, the critical value of the test will be
(Multiple Choice)
4.9/5 (37)
Filters
- Essay(0)
- Multiple Choice(0)
- Short Answer(0)
- True False(0)
- Matching(0)