Exam 3: Numerical Descriptive Measures
Exam 1: Introduction145 Questions
Exam 2: Organizing and Visualizing Data210 Questions
Exam 3: Numerical Descriptive Measures153 Questions
Exam 4: Basic Probability171 Questions
Exam 5: Discrete Probability Distributions218 Questions
Exam 6: The Normal Distribution and Other Continuous Distributions191 Questions
Exam 7: Sampling and Sampling Distributions197 Questions
Exam 8: Confidence Interval Estimation196 Questions
Exam 9: Fundamentals of Hypothesis Testing: One-Sample Tests165 Questions
Exam 10: Two-Sample Tests210 Questions
Exam 11: Analysis of Variance213 Questions
Exam 12: Chi-Square Tests and Nonparametric Tests201 Questions
Exam 13: Simple Linear Regression213 Questions
Exam 14: Introduction to Multiple Regression355 Questions
Exam 15: Multiple Regression Model Building96 Questions
Exam 16: Time-Series Forecasting168 Questions
Exam 17: Statistical Applications in Quality Management133 Questions
Exam 18: A Roadmap for Analyzing Data54 Questions
Exam 19: Questions that Involve Online Topics321 Questions
Select questions type
Which of the following is not a measure of central tendency?
Free
(Multiple Choice)
4.8/5  (35)
(35)
Correct Answer: Verified
D
According to the Chebyshev rule, at least what percentage of the observations in any data set are contained within a distance of 3 standard deviations around the mean?
Free
(Multiple Choice)
4.8/5 (35)
Correct Answer:Verified
C
TABLE 3-10
The population of eight analysts at a software firm were asked to estimate the reuse rate when developing a new software system. The following data are given as a percentage of the total code written for a software system that is part of the reuse database.
50, 62.5, 37.5, 75.0, 45.0, 47.5, 15.0, 25.0
-Referring to Table 3-10, what are the variance and standard deviation of the total code that is part of the reuse database?
Free
(Short Answer)
4.9/5 (41)
Correct Answer:Verified
324.12 and 18.00, respectively
TABLE 3-1
Health care issues are receiving much attention in both academic and political arenas. A sociologist recently conducted a survey of citizens over 60 years of age whose net worth is too high to qualify for Medicaid. The ages of 25 senior citizens were as follows:  -Referring to Table 3-1, determine which of the following is the correct statement.
(Multiple Choice)
4.8/5 (42)
TABLE 3-4
The ordered array below represents the number of cargo manifests approved by customs inspectors of the Port of New York in a sample of 35 days:
16, 17, 18, 18, 19, 20, 20, 21, 21, 21, 22, 22, 22, 22, 23, 23, 23, 23, 24, 24, 24, 25, 25, 26, 26, 26, 27, 28, 28, 29, 29, 31, 31, 32, 32
Note: For this sample, the sum of the values is 838, and the sum of the squared differences between each value and the mean is 619.89.
-Referring to Table 3-4, the five-number summary for the data in the customs sample consists of ________, ________, ________, ________, ________.
(Short Answer)
4.9/5 (37)
TABLE 3-1
Health care issues are receiving much attention in both academic and political arenas. A sociologist recently conducted a survey of citizens over 60 years of age whose net worth is too high to qualify for Medicaid. The ages of 25 senior citizens were as follows:
-Referring to Table 3-1, calculate the arithmetic mean age of the senior citizens to the nearest hundredth of a year.
(Short Answer)
4.7/5 (35)
The geometric mean is a measure of variation or dispersion in a set of data.
(True/False)
4.8/5 (34)
Which of the arithmetic mean, median, mode, and geometric mean are resistant measures of central tendency?
(Multiple Choice)
4.8/5 (27)
TABLE 3-2
The data below represent the amount of grams of carbohydrates in a serving of breakfast cereal in a sample of 11 different servings.
11 15 23 29 19 22 21 20 15 25 17
-Referring to Table 3-2, the variance of the carbohydrate amounts is ________ (grams squared).
(Short Answer)
4.9/5 (45)
TABLE 3-4
The ordered array below represents the number of cargo manifests approved by customs inspectors of the Port of New York in a sample of 35 days:
16, 17, 18, 18, 19, 20, 20, 21, 21, 21, 22, 22, 22, 22, 23, 23, 23, 23, 24, 24, 24, 25, 25, 26, 26, 26, 27, 28, 28, 29, 29, 31, 31, 32, 32
Note: For this sample, the sum of the values is 838, and the sum of the squared differences between each value and the mean is 619.89.
-Referring to Table 3-4, the interquartile range of the customs data is ________.
(Short Answer)
4.8/5 (30)
TABLE 3-8
The time period from 2006 to 2009 saw a great deal of volatility in the value of stocks. The data in the following table represent the total rate of return of our companies from 2006 to 2009.
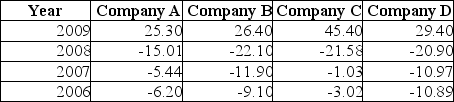 -Referring to Table 3-8, calculate the geometric mean rate of return per year for Company A.
(Short Answer)
4.9/5 (32)
TABLE 3-5
The rates of return of a Fortune 500 company over the past 15 years are: 3.17%, 4.43%, 5.93%, 5.43%, 7.29%, 8.21%, 6.23%, 5.23%, 4.34%, 6.68%, 7.14%, -5.56%, -5.23%, -5.73%, -10.34%
-Referring to Table 3-5, compute the geometric mean rate of return per year for the first four years.
(Short Answer)
4.8/5 (42)
TABLE 3-5
The rates of return of a Fortune 500 company over the past 15 years are: 3.17%, 4.43%, 5.93%, 5.43%, 7.29%, 8.21%, 6.23%, 5.23%, 4.34%, 6.68%, 7.14%, -5.56%, -5.23%, -5.73%, -10.34%
-Referring to Table 3-5, what is the range of the rate of return?
(Short Answer)
4.9/5 (38)
TABLE 3-3
The ordered array below represents the number of vitamin supplements sold by a health food store in a sample of 16 days.
19, 19, 20, 20, 22, 23, 25, 26, 27, 30, 33, 34, 35, 36, 38, 41
Note: For this sample, the sum of the values is 448, and the sum of the squared differences between each value and the mean is 812.
-Referring to Table 3-3, the first quartile of the number of vitamin supplements sold in this sample is ________.
(Short Answer)
4.8/5 (29)
TABLE 3-2
The data below represent the amount of grams of carbohydrates in a serving of breakfast cereal in a sample of 11 different servings.
11 15 23 29 19 22 21 20 15 25 17
-Referring to Table 3-2, the interquartile range in the carbohydrate amounts is ________ grams.
(Short Answer)
4.8/5 (39)
TABLE 3-11
Given below are the closing prices for the Dow Jones Industrial Average (DJIA) and the Standard & Poor's (S&P) 500 Index over 10 weeks.
 -Referring to Table 3-11, what is the sample covariance between the DJIA and the S&P 500 index?
(Short Answer)
4.7/5 (36)
TABLE 3-2
The data below represent the amount of grams of carbohydrates in a serving of breakfast cereal in a sample of 11 different servings.
11 15 23 29 19 22 21 20 15 25 17
-Referring to Table 3-2, the first quartile of the carbohydrate amounts is ________ grams.
(Short Answer)
4.8/5 (38)
TABLE 3-13
Energy drink consumption has continued to gain in popularity since the 1997 debut of Red Bull, the current leader in the energy drink market. Given below are the exam scores and the number of 12-ounce energy drinks consumed within a week prior to the exam of 10 college students.
 -Referring to Table 3-13, what is the sample correlation coefficient between the exam scores and the number of energy drinks consumed?
(Short Answer)
4.9/5 (35)
Filters
- Essay(0)
- Multiple Choice(0)
- Short Answer(0)
- True False(0)
- Matching(0)