Exam 2: Organizing and Visualizing Data
Exam 1: Introduction145 Questions
Exam 2: Organizing and Visualizing Data210 Questions
Exam 3: Numerical Descriptive Measures153 Questions
Exam 4: Basic Probability171 Questions
Exam 5: Discrete Probability Distributions218 Questions
Exam 6: The Normal Distribution and Other Continuous Distributions191 Questions
Exam 7: Sampling and Sampling Distributions197 Questions
Exam 8: Confidence Interval Estimation196 Questions
Exam 9: Fundamentals of Hypothesis Testing: One-Sample Tests165 Questions
Exam 10: Two-Sample Tests210 Questions
Exam 11: Analysis of Variance213 Questions
Exam 12: Chi-Square Tests and Nonparametric Tests201 Questions
Exam 13: Simple Linear Regression213 Questions
Exam 14: Introduction to Multiple Regression355 Questions
Exam 15: Multiple Regression Model Building96 Questions
Exam 16: Time-Series Forecasting168 Questions
Exam 17: Statistical Applications in Quality Management133 Questions
Exam 18: A Roadmap for Analyzing Data54 Questions
Exam 19: Questions that Involve Online Topics321 Questions
Select questions type
TABLE 2-7
The Stem-and-Leaf display below contains data on the number of months between the date a civil suit is filed and when the case is actually adjudicated for 50 cases heard in superior court.
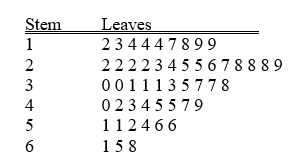 -Referring to Table 2-7, if a frequency distribution with equal sized classes was made from this data, and the first class was "10 but less than 20," the relative frequency of the third class would be ________.
Free
(Short Answer)
4.9/5  (39)
(39)
Correct Answer: Verified
0.20 or 20% or 10/50
To determine the width of class interval, divide the number of class groups by the range of the data.
Free
(True/False)
4.7/5 (37)
Correct Answer:Verified
False
When polygons or histograms are constructed, which axis must show the true zero or "origin"?
Free
(Multiple Choice)
5.0/5 (30)
Correct Answer:Verified
B
TABLE 2-16
The figure below is the percentage polygon for the amount of calories for a sample of 36 pizzas products where the upper limits of the intervals are: 310, 340, 370, 400 and 430.
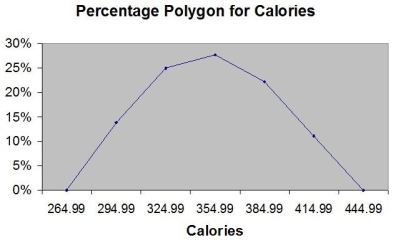 -Referring to Table 2-16, roughly what percentage of pizza products contains between 400 and 430 calories?
(Multiple Choice)
4.9/5 (33)
TABLE 2-10
The histogram below represents scores achieved by 200 job applicants on a personality profile.
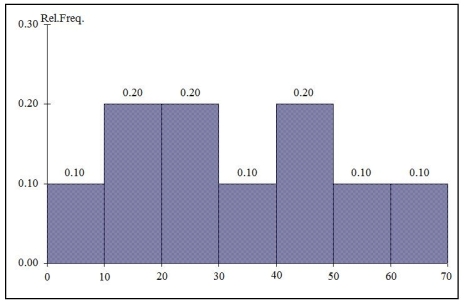 -Referring to the histogram from Table 2-10, the number of job applicants who scored 50 or above is ________.
(Short Answer)
4.8/5 (36)
TABLE 2-5
The following are the duration in minutes of a sample of long-distance phone calls made within the continental United States reported by one long-distance carrier.  -Referring to Table 2-5, what is the cumulative relative frequency for the percentage of calls that lasted 10 minutes or more?
(Multiple Choice)
4.8/5 (27)
TABLE 2-14
The table below contains the number of people who own a portable DVD player in a sample of 600 broken down by gender.
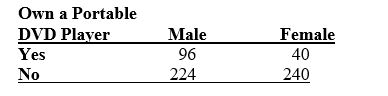 -Referring to Table 2-14, ________ percent of the 600 were males who did not own a portable DVD.
(Short Answer)
4.9/5 (33)
TABLE 2-16
The figure below is the percentage polygon for the amount of calories for a sample of 36 pizzas products where the upper limits of the intervals are: 310, 340, 370, 400 and 430.
-Referring to Table 2-16, roughly what percentage of pizza products contains between 340 and 400 calories?
(Multiple Choice)
5.0/5 (38)
TABLE 2-7
The Stem-and-Leaf display below contains data on the number of months between the date a civil suit is filed and when the case is actually adjudicated for 50 cases heard in superior court.
-Referring to Table 2-7, locate the first leaf, i.e., the lowest valued leaf with the lowest valued stem. This represents a wait of ________ months.
(Short Answer)
4.8/5 (36)
TABLE 2-7
The Stem-and-Leaf display below contains data on the number of months between the date a civil suit is filed and when the case is actually adjudicated for 50 cases heard in superior court.
-Referring to Table 2-7, the civil suit with the longest wait between when the suit was filed and when it was adjudicated had a wait of ________ months.
(Short Answer)
5.0/5 (42)
In general, grouped frequency distributions should have between 5 and 15 class intervals.
(True/False)
4.8/5 (27)
Given below is the scatter plot of the market value (thousands$) and profit (thousands$) of 50 U.S. companies. Higher market values appear to be associated with higher profits.
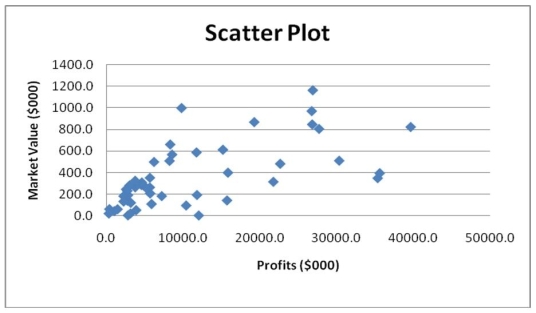
(True/False)
4.9/5 (43)
Apple Computer, Inc. collected information on the age of their customers. The youngest customer was 12 and the oldest was 72. To study the percentage of their customers who are below a certain age, it can use an ogive.
(True/False)
4.9/5 (33)
TABLE 2-9
The frequency distribution below represents the rents of 250 randomly selected federally subsidized apartments in a small town.
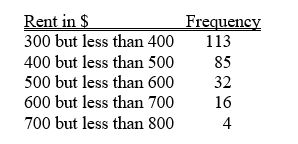 -Referring to Table 2-9, ________ percent of the apartments rented for at least $500.
(Short Answer)
4.7/5 (38)
TABLE 2-18
The stem-and-leaf display below shows the result of a survey on 50 students on their satisfaction with their school with the higher scores represent higher level of satisfaction.
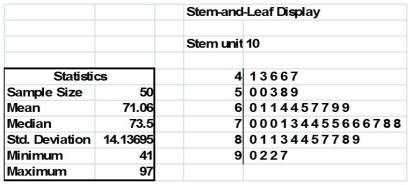 -Referring to Table 2-18, how many students have a satisfaction level in the 50s?
(Short Answer)
4.7/5 (38)
The stem-and-leaf display is often superior to the frequency distribution in that it maintains the original values for further analysis.
(True/False)
4.9/5 (39)
TABLE 2-14
The table below contains the number of people who own a portable DVD player in a sample of 600 broken down by gender.
-Referring to Table 2-14, if the sample is a good representation of the population, we can expect ________ percent of the males in the population will own a portable DVD.
(Short Answer)
4.7/5 (32)
TABLE 2-10
The histogram below represents scores achieved by 200 job applicants on a personality profile.
-Referring to the histogram from Table 2-10, the number of job applicants who scored between 30 and below 60 is ________.
(Short Answer)
4.9/5 (26)
TABLE 2-13
Given below is the stem-and-leaf display representing the amount of detergent used in gallons (with leaves in tenths of gallons) in a day by 25 drive-through car wash operations in Phoenix.
9 | 1 4 7
10 | 0 2 2 3 8
11 | 1 3 5 5 6 6 7 7 7
12 | 2 2 3 4 8 9
13 | 0 2
-Referring to Table 2-13, if a frequency distribution for the amount of detergent used is constructed, using "9.0 but less than 10.0 gallons" as the first class, the frequency of the "11.0 but less than 12.0 gallons" class would be ________.
(Short Answer)
4.8/5 (38)
TABLE 2-14
The table below contains the number of people who own a portable DVD player in a sample of 600 broken down by gender.
-Referring to Table 2-14, if the sample is a good representation of the population, we can expect ________ percent of the population will own a portable DVD.
(Short Answer)
4.8/5 (24)
Filters
- Essay(0)
- Multiple Choice(0)
- Short Answer(0)
- True False(0)
- Matching(0)