Exam 17: Statistical Applications in Quality Management
Exam 1: Introduction145 Questions
Exam 2: Organizing and Visualizing Data210 Questions
Exam 3: Numerical Descriptive Measures153 Questions
Exam 4: Basic Probability171 Questions
Exam 5: Discrete Probability Distributions218 Questions
Exam 6: The Normal Distribution and Other Continuous Distributions191 Questions
Exam 7: Sampling and Sampling Distributions197 Questions
Exam 8: Confidence Interval Estimation196 Questions
Exam 9: Fundamentals of Hypothesis Testing: One-Sample Tests165 Questions
Exam 10: Two-Sample Tests210 Questions
Exam 11: Analysis of Variance213 Questions
Exam 12: Chi-Square Tests and Nonparametric Tests201 Questions
Exam 13: Simple Linear Regression213 Questions
Exam 14: Introduction to Multiple Regression355 Questions
Exam 15: Multiple Regression Model Building96 Questions
Exam 16: Time-Series Forecasting168 Questions
Exam 17: Statistical Applications in Quality Management133 Questions
Exam 18: A Roadmap for Analyzing Data54 Questions
Exam 19: Questions that Involve Online Topics321 Questions
Select questions type
TABLE 17-8
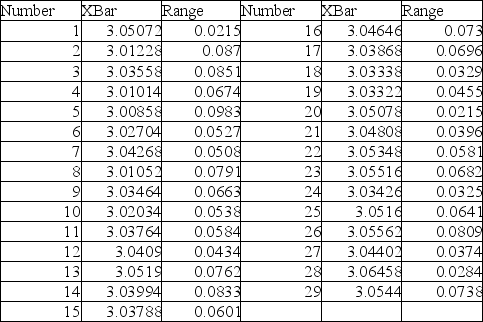
Recently, a university switched to a new type of computer-based registration. The registrar is concerned with the amount of time students are spending on the computer registering under the new system. She decides to randomly select 8 students on each of the 12 days of the registration and determine the time each spends on the computer registering. The range, mean, and standard deviation of the times required to register are in the table that follows. 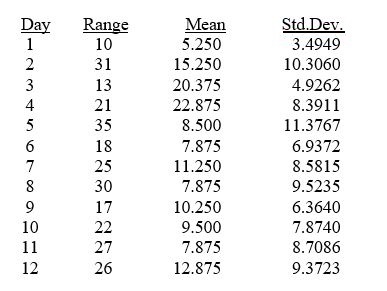 -Referring to Table 17-8, based on the R chart, it appears that the process is out of control.
Free
(True/False)
4.8/5  (39)
(39)
Correct Answer: Verified
False
TABLE 17-8
Recently, a university switched to a new type of computer-based registration. The registrar is concerned with the amount of time students are spending on the computer registering under the new system. She decides to randomly select 8 students on each of the 12 days of the registration and determine the time each spends on the computer registering. The range, mean, and standard deviation of the times required to register are in the table that follows.
-Referring to Table 17-8, an R chart is to be constructed for the time required to register. The lower control limit for this data set is ________.
Free
(Short Answer)
4.8/5 (41)
Correct Answer:Verified
3.117
TABLE 17-8
Recently, a university switched to a new type of computer-based registration. The registrar is concerned with the amount of time students are spending on the computer registering under the new system. She decides to randomly select 8 students on each of the 12 days of the registration and determine the time each spends on the computer registering. The range, mean, and standard deviation of the times required to register are in the table that follows.
-Referring to Table 17-8, construct an  chart for the time required to register.
Free
(Essay)
4.9/5 (25)
Correct Answer:Verified
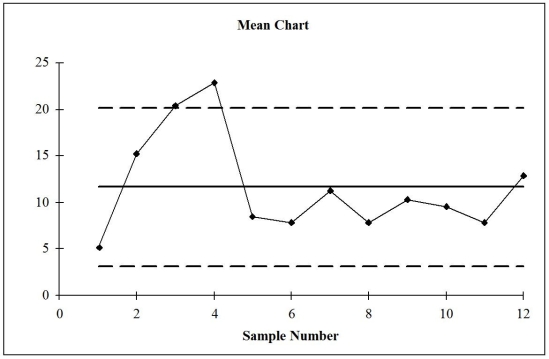
TABLE 17-8
Recently, a university switched to a new type of computer-based registration. The registrar is concerned with the amount of time students are spending on the computer registering under the new system. She decides to randomly select 8 students on each of the 12 days of the registration and determine the time each spends on the computer registering. The range, mean, and standard deviation of the times required to register are in the table that follows.
-Referring to Table 17-8, an R chart is to be constructed for the time required to register. The upper control limit for this data set is ________.
(Short Answer)
4.9/5 (30)
Common causes of variation are correctable without modifying the system.
(True/False)
4.7/5 (43)
TABLE 17-7
A supplier of silicone sheets for producers of computer chips wants to evaluate her manufacturing process. She takes samples of size 5 from each day's output and counts the number of blemishes on each silicone sheet. The results from 20 days of such evaluations are presented below. 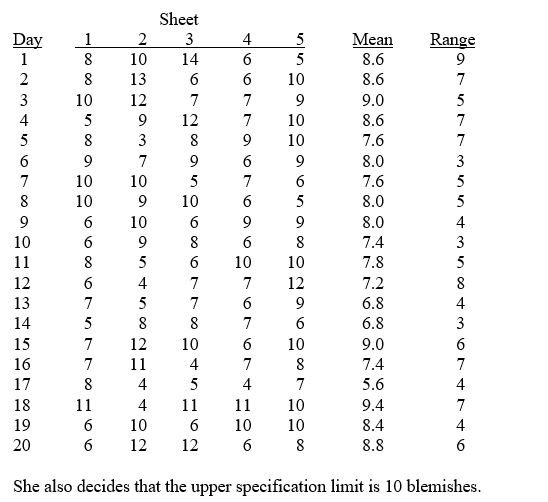 -Referring to Table 17-7, an R chart is to be constructed for the number of blemishes. One way to create the lower control limit involves multiplying the mean of the sample ranges by D₃. For this data set, the value of D₃ is ________.
(Short Answer)
4.8/5 (37)
Determining the root causes of why defects can occur along with the variables in the process that cause these defects to occur involves which part of the DMAIC process?
(Multiple Choice)
4.8/5 (39)
TABLE 17-5
A manufacturer of computer disks took samples of 240 disks on 15 consecutive days. The number of disks with bad sectors was determined for each of these samples. The results are in the table that follows. 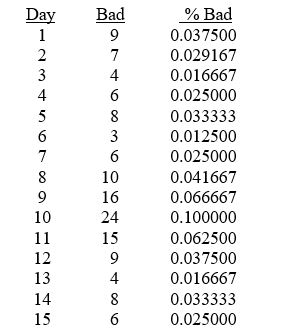 -Referring to Table 17-5, a p control chart is to be made for these data. The estimate of the standard error of the proportion of disks with bad sectors is ________.
(Short Answer)
4.8/5 (30)
TABLE 17-9
The manufacturer of canned food constructed control charts and analyzed several quality characteristics. One characteristic of interest is the weight of the filled cans. The lower specification limit for weight is 2.95 pounds. The table below provides the range and mean of the weights of five cans tested every fifteen minutes during a day's production.
 -Referring to Table 17-9, an R chart is to be constructed for the weight. The lower control limit for this data set is ________.
(Short Answer)
4.9/5 (35)
TABLE 17-9
The manufacturer of canned food constructed control charts and analyzed several quality characteristics. One characteristic of interest is the weight of the filled cans. The lower specification limit for weight is 2.95 pounds. The table below provides the range and mean of the weights of five cans tested every fifteen minutes during a day's production.
-Referring to Table 17-9, an  chart is to be used for the weight. One way to obtain the control limits is to take the grand mean and add and subtract the product of A₂ times the mean of the sample ranges. For this data set, the value of A₂ is ________.
(Short Answer)
4.9/5 (33)
TABLE 17-6
The maker of a packaged candy wants to evaluate the quality of her production process. On each of 16 consecutive days, she samples 600 bags of candy and determines the number in each day's sample that she considers to be of poor quality. The data that she developed follow. 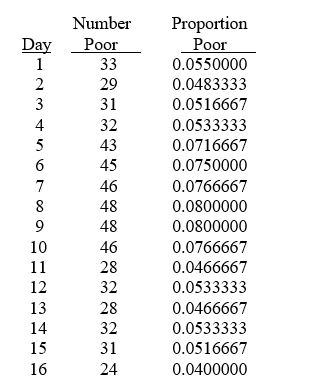 -Referring to Table 17-6, a p control chart is to be constructed for these data. The estimate of the standard error of the sample proportion is ________.
(Short Answer)
4.7/5 (30)
TABLE 17-7
A supplier of silicone sheets for producers of computer chips wants to evaluate her manufacturing process. She takes samples of size 5 from each day's output and counts the number of blemishes on each silicone sheet. The results from 20 days of such evaluations are presented below.
-Referring to Table 17-7, an R chart is to be constructed for the number of blemishes. The center line of this R chart is located at ________.
(Short Answer)
4.9/5 (37)
TABLE 17-8
Recently, a university switched to a new type of computer-based registration. The registrar is concerned with the amount of time students are spending on the computer registering under the new system. She decides to randomly select 8 students on each of the 12 days of the registration and determine the time each spends on the computer registering. The range, mean, and standard deviation of the times required to register are in the table that follows.
-Referring to Table 17-8, an R chart is to be constructed for the time required to register. The center line of this R chart is located at ________.
(Short Answer)
4.8/5 (34)
Developing operational definitions for each critical-to-quality characteristic involves which part of the DMAIC process?
(Multiple Choice)
4.8/5 (39)
TABLE 17-2
A political pollster randomly selects a sample of 100 voters each day for 8 successive days and asks how many will vote for the incumbent. The pollster wishes to construct a p chart to see if the percentage favoring the incumbent candidate is too erratic. 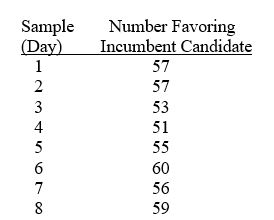 -Referring to Table 17-2, what is the numerical value of the upper control limit for the p chart?
(Multiple Choice)
4.8/5 (40)
TABLE 17-7
A supplier of silicone sheets for producers of computer chips wants to evaluate her manufacturing process. She takes samples of size 5 from each day's output and counts the number of blemishes on each silicone sheet. The results from 20 days of such evaluations are presented below.
-Referring to Table 17-7, an R chart is to be constructed for the number of blemishes. The upper control limit for this data set is ________.
(Short Answer)
4.7/5 (30)
TABLE 17-8
Recently, a university switched to a new type of computer-based registration. The registrar is concerned with the amount of time students are spending on the computer registering under the new system. She decides to randomly select 8 students on each of the 12 days of the registration and determine the time each spends on the computer registering. The range, mean, and standard deviation of the times required to register are in the table that follows.
-Referring to Table 17-8, based on  the chart, it appears that the process is in control.
(True/False)
4.9/5 (28)
Referring to Table 17-3, suppose the analyst constructs an  chart to see if the production process is in-control. What is the upper control limit (UCL) for this chart?
(Multiple Choice)
4.8/5 (40)
A process capability is estimated by the percentage of product or service that fall outside the specification limits.
(True/False)
4.9/5 (37)
TABLE 17-5
A manufacturer of computer disks took samples of 240 disks on 15 consecutive days. The number of disks with bad sectors was determined for each of these samples. The results are in the table that follows.
-Referring to Table 17-5, construct a p control chart for these data.
(Essay)
4.7/5 (30)
Filters
- Essay(0)
- Multiple Choice(0)
- Short Answer(0)
- True False(0)
- Matching(0)