Exam 12: Chi-Square Tests and Nonparametric Tests
Exam 1: Introduction145 Questions
Exam 2: Organizing and Visualizing Data210 Questions
Exam 3: Numerical Descriptive Measures153 Questions
Exam 4: Basic Probability171 Questions
Exam 5: Discrete Probability Distributions218 Questions
Exam 6: The Normal Distribution and Other Continuous Distributions191 Questions
Exam 7: Sampling and Sampling Distributions197 Questions
Exam 8: Confidence Interval Estimation196 Questions
Exam 9: Fundamentals of Hypothesis Testing: One-Sample Tests165 Questions
Exam 10: Two-Sample Tests210 Questions
Exam 11: Analysis of Variance213 Questions
Exam 12: Chi-Square Tests and Nonparametric Tests201 Questions
Exam 13: Simple Linear Regression213 Questions
Exam 14: Introduction to Multiple Regression355 Questions
Exam 15: Multiple Regression Model Building96 Questions
Exam 16: Time-Series Forecasting168 Questions
Exam 17: Statistical Applications in Quality Management133 Questions
Exam 18: A Roadmap for Analyzing Data54 Questions
Exam 19: Questions that Involve Online Topics321 Questions
Select questions type
TABLE 12-19
As part of an evaluation program, a sporting goods retailer wanted to compare the downhill coasting speeds of 4 brands of bicycles. She took 3 of each brand and determined their maximum downhill speeds. The results are presented in miles per hour in the table below
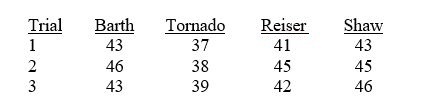 -Referring to Table 12-19, the sporting goods retailer decided to perform a Kruskal-Wallis test even though the sample size in each of the 4 groups is not larger than 5. The null hypothesis of the test is ________.
(Short Answer)
4.8/5  (35)
(35)
The chi-square test of independence requires that the expected frequency in each cell to be at least 5.
(True/False)
4.7/5 (36)
TABLE 12-6
According to an article in Marketing News, fewer checks are being written at the grocery store checkout than in the past. To determine whether there is a difference in the proportion of shoppers who pay by check among three consecutive years at a 0.05 level of significance, the results of a survey of 500 shoppers in three consecutive years are obtained and presented below.
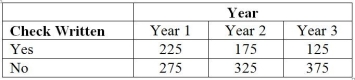 -Referring to Table 12-6, what is the critical value?
(Short Answer)
4.8/5 (32)
TABLE 12-7
Data on the percentage of 200 hotels in each of the three large cities across the world on whether minibar charges are correctly posted at checkout are given below.
 At the 0.05 level of significance, you want to know if there is evidence of a difference in the proportion of hotels that correctly post minibar charges among the three cities.
-Referring to Table 12-7, what are the values of the absolute difference and the critical range for the Marascuilo procedure to test for the difference in proportions between Hong Kong and Paris using a 0.05 level of significance?
At the 0.05 level of significance, you want to know if there is evidence of a difference in the proportion of hotels that correctly post minibar charges among the three cities.
-Referring to Table 12-7, what are the values of the absolute difference and the critical range for the Marascuilo procedure to test for the difference in proportions between Hong Kong and Paris using a 0.05 level of significance?
(Short Answer)
4.9/5 (34)
TABLE 12-4
A computer used by a 24-hour banking service is supposed to randomly assign each transaction to one of 5 memory locations. A check at the end of a day's transactions gave the counts shown in the table to each of the 5 memory locations, along with the number of reported errors.
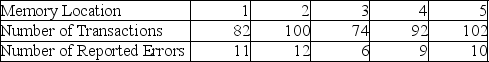 The bank manager wanted to test whether the proportion of errors in transactions assigned to each of the 5 memory locations differ.
-Referring to Table 12-4, which test would be used to properly analyze the data in this experiment?
The bank manager wanted to test whether the proportion of errors in transactions assigned to each of the 5 memory locations differ.
-Referring to Table 12-4, which test would be used to properly analyze the data in this experiment?
(Multiple Choice)
4.7/5 (33)
TABLE 12-1
A corporation randomly selects 150 salespeople and finds that 66% who have never taken a self-improvement course would like such a course. The firm did a similar study 10 years ago in which 60% of a random sample of 160 salespeople wanted a self-improvement course. The groups are assumed to be independent random samples. Let π₁ and π₂ represent the true proportion of workers who would like to attend a self-improvement course in the recent study and the past study, respectively.
-Referring to Table 12-1, if the firm wanted to test whether this proportion has changed from the previous study, which represents the relevant hypotheses?
(Multiple Choice)
4.9/5 (33)
TABLE 12-10
One criterion used to evaluate employees in the assembly section of a large factory is the number of defective pieces per 1,000 parts produced. The quality control department wants to find out whether there is a relationship between years of experience and defect rate. Since the job is repetitious, after the initial training period any improvement due to a learning effect might be offset by a loss of motivation. A defect rate is calculated for each worker in a yearly evaluation. The results for 100 workers are given in the table below.
 -Referring to Table 12-10, what is the expected number of employees with less than 1 year of training time and a high defect rate?
(Multiple Choice)
4.8/5 (37)
TABLE 12-19
As part of an evaluation program, a sporting goods retailer wanted to compare the downhill coasting speeds of 4 brands of bicycles. She took 3 of each brand and determined their maximum downhill speeds. The results are presented in miles per hour in the table below
-Referring to Table 12-19, to use the chi-square critical value for the Kruskal-Wallis test, the sample size in each group has to be greater than ________.
(Short Answer)
4.8/5 (29)
TABLE 12-8
A study published in the American Journal of Public Health was conducted to determine whether the use of seat belts in motor vehicles in San Diego County depends on ethnic status. A sample of 792 children treated for injuries sustained from motor vehicle accidents was obtained, and each child was classified according to (1) ethnic status (Hispanic or non-Hispanic) and (2) seat belt usage (worn or not worn) during the accident. The number of children in each category is given in the table below.
 -Referring to Table 12-8, the calculated test statistic is
(Multiple Choice)
4.8/5 (36)
In testing the difference between two proportions using the normal distribution, we may use either a one-tail Chi-square test or two-tail Z test.
(True/False)
4.8/5 (32)
If we wish to determine whether there is evidence that the proportion of items of interest is the same in group 1 as in group 2, the appropriate test to use is
(Multiple Choice)
4.9/5 (34)
TABLE 12-19
As part of an evaluation program, a sporting goods retailer wanted to compare the downhill coasting speeds of 4 brands of bicycles. She took 3 of each brand and determined their maximum downhill speeds. The results are presented in miles per hour in the table below
-Referring to Table 12-19, the decision rule for a level of significance of 0.05 using the Kruskal-Wallis test is to reject the null hypothesis if the test statistic H is ________ assuming that the sample sizes were large enough to use a chi-square approximation.
(Short Answer)
4.7/5 (38)
TABLE 12-7
Data on the percentage of 200 hotels in each of the three large cities across the world on whether minibar charges are correctly posted at checkout are given below.
At the 0.05 level of significance, you want to know if there is evidence of a difference in the proportion of hotels that correctly post minibar charges among the three cities.
-Referring to Table 12-7, the decision made suggests that the 3 cities do not all have the same proportion of hotels that correctly post minibar charges.
(True/False)
4.8/5 (35)
TABLE 12-10
One criterion used to evaluate employees in the assembly section of a large factory is the number of defective pieces per 1,000 parts produced. The quality control department wants to find out whether there is a relationship between years of experience and defect rate. Since the job is repetitious, after the initial training period any improvement due to a learning effect might be offset by a loss of motivation. A defect rate is calculated for each worker in a yearly evaluation. The results for 100 workers are given in the table below.
-Referring to Table 12-10, which test would be used to properly analyze the data in this experiment to determine whether there is a relationship between defect rate and years of experience?
(Multiple Choice)
4.7/5 (35)
TABLE 12-13
Recent studies have found that American children are more obese than in the past. The amount of time children spent watching television has received much of the blame. A survey of 100 ten-year-olds revealed the following with regards to weights and average number of hours a day spent watching television. We are interested in testing whether the mean number of hours spent watching TV and weights are independent at 1% level of significance.
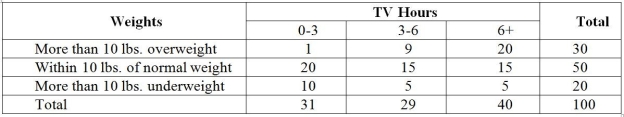 -Referring to Table 12-13, how many children in the survey spend more than 6 hours watching TV and are more than 10 lbs. overweight?
(Multiple Choice)
5.0/5 (35)
TABLE 12-19
As part of an evaluation program, a sporting goods retailer wanted to compare the downhill coasting speeds of 4 brands of bicycles. She took 3 of each brand and determined their maximum downhill speeds. The results are presented in miles per hour in the table below
-Referring to Table 12-19, the alternative hypothesis of the Kruskal-Wallis test is that ________.
(Short Answer)
4.8/5 (38)
TABLE 12-16
A filling machine at a local soft drinks company is calibrated to fill the cans at a mean amount of 12 fluid ounces and a standard deviation of 0.5 ounces. The company wants to test whether the standard deviation of the amount filled by the machine is 0.5 ounces. A random sample of 15 cans filled by the machine reveals a standard deviation of 0.67 ounces.
-Referring to Table 12-16, the decision is to reject the null hypothesis when using a 5% level of significance.
(True/False)
4.9/5 (33)
TABLE 12-14
The director of transportation of a large company is interested in the usage of the company's van pool program. She surveyed 129 of her employees on the usage of the program before and after a campaign to convince her employees to use the service and obtained the following:
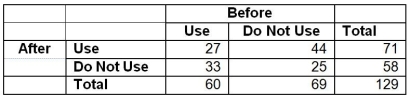 She will use this information to perform test using a level of significance of 0.05.
-Referring to Table 12-14, the director now wants to know if the proportion of employees who use the service before the campaign and the proportion of employees who use the service after the campaign are the same. She should reject the null hypothesis using a 5% level of significance.
She will use this information to perform test using a level of significance of 0.05.
-Referring to Table 12-14, the director now wants to know if the proportion of employees who use the service before the campaign and the proportion of employees who use the service after the campaign are the same. She should reject the null hypothesis using a 5% level of significance.
(True/False)
4.8/5 (41)
TABLE 12-6
According to an article in Marketing News, fewer checks are being written at the grocery store checkout than in the past. To determine whether there is a difference in the proportion of shoppers who pay by check among three consecutive years at a 0.05 level of significance, the results of a survey of 500 shoppers in three consecutive years are obtained and presented below.
-Referring to Table 12-6, what is the expected number of shoppers who do not pay by check in year 3 if there is no difference in the proportion of shoppers who pay by check among the three years?
(Short Answer)
4.9/5 (34)
TABLE 12-7
Data on the percentage of 200 hotels in each of the three large cities across the world on whether minibar charges are correctly posted at checkout are given below.
At the 0.05 level of significance, you want to know if there is evidence of a difference in the proportion of hotels that correctly post minibar charges among the three cities.
-Referring to Table 12-7, the value of the test statistic is ________.
(Short Answer)
4.8/5 (40)
Filters
- Essay(0)
- Multiple Choice(0)
- Short Answer(0)
- True False(0)
- Matching(0)