Exam 3: Numerical Descriptive Measures
Exam 1: Introduction145 Questions
Exam 2: Organizing and Visualizing Data210 Questions
Exam 3: Numerical Descriptive Measures153 Questions
Exam 4: Basic Probability171 Questions
Exam 5: Discrete Probability Distributions218 Questions
Exam 6: The Normal Distribution and Other Continuous Distributions191 Questions
Exam 7: Sampling and Sampling Distributions197 Questions
Exam 8: Confidence Interval Estimation196 Questions
Exam 9: Fundamentals of Hypothesis Testing: One-Sample Tests165 Questions
Exam 10: Two-Sample Tests210 Questions
Exam 11: Analysis of Variance213 Questions
Exam 12: Chi-Square Tests and Nonparametric Tests201 Questions
Exam 13: Simple Linear Regression213 Questions
Exam 14: Introduction to Multiple Regression355 Questions
Exam 15: Multiple Regression Model Building96 Questions
Exam 16: Time-Series Forecasting168 Questions
Exam 17: Statistical Applications in Quality Management133 Questions
Exam 18: A Roadmap for Analyzing Data54 Questions
Exam 19: Questions that Involve Online Topics321 Questions
Select questions type
The line drawn within the box of the boxplot always represents the median.
(True/False)
4.8/5  (35)
(35)
TABLE 3-5
The rates of return of a Fortune 500 company over the past 15 years are: 3.17%,4.43%,5.93%,5.43%,7.29%,8.21%,6.23%,5.23%,4.34%,6.68%,7.14%,-5.56%,-5.23%,-5.73%,-10.34%
-Referring to Table 3-5,compute the arithmetic mean rate of return per year.
(Short Answer)
4.9/5 (32)
TABLE 3-5
The rates of return of a Fortune 500 company over the past 15 years are: 3.17%,4.43%,5.93%,5.43%,7.29%,8.21%,6.23%,5.23%,4.34%,6.68%,7.14%,-5.56%,-5.23%,-5.73%,-10.34%
-Referring to Table 3-5,construct a boxplot for the rate of return.
(Essay)
4.8/5 (38)
TABLE 3-1
Health care issues are receiving much attention in both academic and political arenas.A sociologist recently conducted a survey of citizens over 60 years of age whose net worth is too high to qualify for Medicaid.The ages of 25 senior citizens were as follows:  -Referring to Table 3-1,calculate the arithmetic mean age of the senior citizens to the nearest hundredth of a year.
(Short Answer)
5.0/5 (30)
According to the empirical rule,if the data form a "bell-shaped" normal distribution,________ percent of the observations will be contained within 2 standard deviations around the arithmetic mean.
(Multiple Choice)
4.9/5 (32)
The line drawn within the box of the boxplot always represents the arithmetic mean.
(True/False)
5.0/5 (34)
TABLE 3-6
The rates of return of an Internet Service Provider over a 10 year period are: 10.25%,12.64%,8.37%,9.29%,6.23%,42.53%,29.23%,15.25%,21.52%,-2.35%.
-The 12-month rate of returns over a three year period of a particular stock is 0.099,-0.289,and 0.089.The geometric mean rate of return per year for this stock is ________.
(Short Answer)
4.8/5 (42)
TABLE 3-11
Given below are the closing prices for the Dow Jones Industrial Average (DJIA)and the Standard & Poor's (S&P)500 Index over 10 weeks.
 -Referring to Table 3-11,for the week when the DJIA is high,you will expect the S&P index in that week to
(Multiple Choice)
4.7/5 (38)
The coefficient of variation measures variability in a data set relative to the size of the arithmetic mean.
(True/False)
4.8/5 (36)
The median of a data set with 20 items would be the average of the 10th and the 11th items in the ordered array.
(True/False)
4.8/5 (34)
TABLE 3-3
The ordered array below represents the number of vitamin supplements sold by a health food store in a sample of 16 days.
19,19,20,20,22,23,25,26,27,30,33,34,35,36,38,41
Note: For this sample,the sum of the values is 448,and the sum of the squared differences between each value and the mean is 812.
-Referring to Table 3-3,the arithmetic mean of the number of vitamin supplements sold in this sample is ________.
(Short Answer)
4.9/5 (36)
TABLE 3-7
In a recent academic year,many public universities in the United States raised tuition and fees due to a decrease in state subsidies.The change in the cost of tuition,a shared dormitory room,and the most popular meal plan from the previous academic year for a sample of 10 public universities were as follows: $1,589,$593,$1,223,$869,$423,$1,720,$708,$1425,$922 and $308.
-Referring to Table 3-7,what is the coefficient of variation of the change in cost?
(Short Answer)
4.9/5 (38)
In a boxplot,the box portion represents the data between the first and third quartile values.
(True/False)
4.8/5 (37)
TABLE 3-12
Given below are the rating and performance scores of 15 laptop computers.
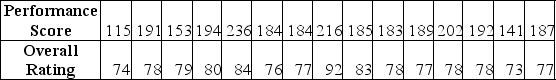 -Referring to Table 3-12,for a laptop computer that has a high rating,you will expect its performance score to
(Multiple Choice)
4.8/5 (35)
TABLE 3-1
Health care issues are receiving much attention in both academic and political arenas.A sociologist recently conducted a survey of citizens over 60 years of age whose net worth is too high to qualify for Medicaid.The ages of 25 senior citizens were as follows:
-Referring to Table 3-1,determine the median age of the senior citizens.
(Short Answer)
4.9/5 (39)
The five-number summary consists of the smallest value,the first quartile,the median,the third quartile,and the largest value.
(True/False)
4.8/5 (39)
TABLE 3-7
In a recent academic year,many public universities in the United States raised tuition and fees due to a decrease in state subsidies.The change in the cost of tuition,a shared dormitory room,and the most popular meal plan from the previous academic year for a sample of 10 public universities were as follows: $1,589,$593,$1,223,$869,$423,$1,720,$708,$1425,$922 and $308.
-Referring to Table 3-7,what is the interquartile range of the change in the cost?
(Short Answer)
4.9/5 (37)
In left-skewed distributions,the distance from the smallest value to Q₁ is greater than the distance from Q₃ to the largest value.
(True/False)
4.8/5 (36)
Filters
- Essay(0)
- Multiple Choice(0)
- Short Answer(0)
- True False(0)
- Matching(0)