Exam 3: Numerical Descriptive Measures
Exam 1: Introduction145 Questions
Exam 2: Organizing and Visualizing Data210 Questions
Exam 3: Numerical Descriptive Measures153 Questions
Exam 4: Basic Probability171 Questions
Exam 5: Discrete Probability Distributions218 Questions
Exam 6: The Normal Distribution and Other Continuous Distributions191 Questions
Exam 7: Sampling and Sampling Distributions197 Questions
Exam 8: Confidence Interval Estimation196 Questions
Exam 9: Fundamentals of Hypothesis Testing: One-Sample Tests165 Questions
Exam 10: Two-Sample Tests210 Questions
Exam 11: Analysis of Variance213 Questions
Exam 12: Chi-Square Tests and Nonparametric Tests201 Questions
Exam 13: Simple Linear Regression213 Questions
Exam 14: Introduction to Multiple Regression355 Questions
Exam 15: Multiple Regression Model Building96 Questions
Exam 16: Time-Series Forecasting168 Questions
Exam 17: Statistical Applications in Quality Management133 Questions
Exam 18: A Roadmap for Analyzing Data54 Questions
Exam 19: Questions that Involve Online Topics321 Questions
Select questions type
TABLE 3-6
The rates of return of an Internet Service Provider over a 10 year period are: 10.25%,12.64%,8.37%,9.29%,6.23%,42.53%,29.23%,15.25%,21.52%,-2.35%.
-You were told that the 1ˢᵗ,2ⁿᵈ and 3ʳᵈ quartiles of female students' weight at a major university are 95 lbs,125 lbs,and 138 lbs.What percentage of the students weigh less than 95 lbs?
(Short Answer)
4.7/5  (37)
(37)
TABLE 3-3
The ordered array below represents the number of vitamin supplements sold by a health food store in a sample of 16 days.
19,19,20,20,22,23,25,26,27,30,33,34,35,36,38,41
Note: For this sample,the sum of the values is 448,and the sum of the squared differences between each value and the mean is 812.
-Referring to Table 3-3,the median number of vitamin supplements sold in this sample is ________.
(Short Answer)
4.8/5 (37)
In right-skewed distributions,which of the following is the correct statement?
(Multiple Choice)
4.8/5 (38)
TABLE 3-8
The time period from 2006 to 2009 saw a great deal of volatility in the value of stocks.The data in the following table represent the total rate of return of our companies from 2006 to 2009.
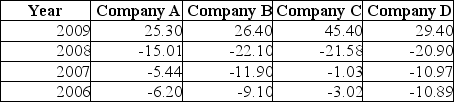 -Referring to Table 3-8,calculate the geometric mean rate of return per year for Company B.
(Short Answer)
4.9/5 (34)
TABLE 3-2
The data below represent the amount of grams of carbohydrates in a serving of breakfast cereal in a sample of 11 different servings.
11 15 23 29 19 22 21 20 15 25 17
-Referring to Table 3-2,the range in the carbohydrate amounts is ________ grams.
(Short Answer)
4.9/5 (35)
TABLE 3-12
Given below are the rating and performance scores of 15 laptop computers.
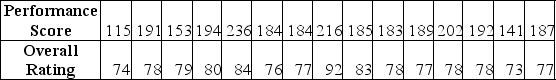 -Referring to Table 3-12,you will expect a decrease in the performance score of one laptop computer to be associated with
(Multiple Choice)
4.7/5 (31)
TABLE 3-13
Energy drink consumption has continued to gain in popularity since the 1997 debut of Red Bull,the current leader in the energy drink market.Given below are the exam scores and the number of 12-ounce energy drinks consumed within a week prior to the exam of 10 college students.
 -Referring to Table 3-13,what is the sample covariance between the exam scores and the number of energy drinks consumed?
(Short Answer)
4.7/5 (35)
TABLE 3-4
The ordered array below represents the number of cargo manifests approved by customs inspectors of the Port of New York in a sample of 35 days:
16,17,18,18,19,20,20,21,21,21,22,22,22,22,23,23,23,23,24,24,24,25,25,26,26,26,27,28,28,29,29,31,31,32,32
Note: For this sample,the sum of the values is 838,and the sum of the squared differences between each value and the mean is 619.89.
-Referring to Table 3-4,the coefficient of variation of the customs data is ________ percent.
(Short Answer)
4.9/5 (38)
TABLE 3-10
The population of eight analysts at a software firm were asked to estimate the reuse rate when developing a new software system.The following data are given as a percentage of the total code written for a software system that is part of the reuse database.
50,62.5,37.5,75.0,45.0,47.5,15.0,25.0
-Referring to Table 3-10,what are the variance and standard deviation of the total code that is part of the reuse database?
(Short Answer)
4.9/5 (30)
TABLE 3-4
The ordered array below represents the number of cargo manifests approved by customs inspectors of the Port of New York in a sample of 35 days:
16,17,18,18,19,20,20,21,21,21,22,22,22,22,23,23,23,23,24,24,24,25,25,26,26,26,27,28,28,29,29,31,31,32,32
Note: For this sample,the sum of the values is 838,and the sum of the squared differences between each value and the mean is 619.89.
-Referring to Table 3-4,the third quartile of the customs data is ________.
(Short Answer)
4.8/5 (38)
TABLE 3-10
The population of eight analysts at a software firm were asked to estimate the reuse rate when developing a new software system.The following data are given as a percentage of the total code written for a software system that is part of the reuse database.
50,62.5,37.5,75.0,45.0,47.5,15.0,25.0
-Referring to Table 3-10,what is the mean percentage of the total code that is part of the reuse database?
(Short Answer)
4.7/5 (32)
TABLE 3-11
Given below are the closing prices for the Dow Jones Industrial Average (DJIA)and the Standard & Poor's (S&P)500 Index over 10 weeks.
 -Referring to Table 3-11,how will you classify the linear relationship between the DJIA and the S&P 500 index?
(Multiple Choice)
4.7/5 (39)
The geometric mean is useful in measuring the rate of change of a variable over time.
(True/False)
4.7/5 (36)
TABLE 3-9
The following table represents the assets in billions of dollars of the five largest bond funds.
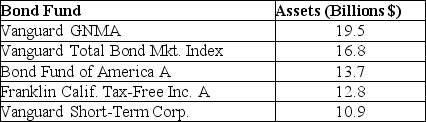 -Referring to Table 3-9,what is the mean for this population of the five largest bond funds?
(Short Answer)
4.8/5 (32)
TABLE 3-4
The ordered array below represents the number of cargo manifests approved by customs inspectors of the Port of New York in a sample of 35 days:
16,17,18,18,19,20,20,21,21,21,22,22,22,22,23,23,23,23,24,24,24,25,25,26,26,26,27,28,28,29,29,31,31,32,32
Note: For this sample,the sum of the values is 838,and the sum of the squared differences between each value and the mean is 619.89.
-Referring to Table 3-4,the median of the customs data is ________.
(Short Answer)
4.9/5 (45)
The coefficient of variation is a measure of relative variation.
(True/False)
4.9/5 (39)
In general,which of the following descriptive summary measures cannot be easily approximated from a boxplot?
(Multiple Choice)
4.9/5 (30)
The interquartile range is a measure of variation or dispersion in a set of data.
(True/False)
4.9/5 (34)
TABLE 3-6
The rates of return of an Internet Service Provider over a 10 year period are: 10.25%,12.64%,8.37%,9.29%,6.23%,42.53%,29.23%,15.25%,21.52%,-2.35%.
-Referring to Table 3-6,compute the geometric mean rate of return per year for the first three years.
(Short Answer)
4.9/5 (35)
Filters
- Essay(0)
- Multiple Choice(0)
- Short Answer(0)
- True False(0)
- Matching(0)