Exam 3: Numerical Descriptive Measures
Exam 1: Introduction145 Questions
Exam 2: Organizing and Visualizing Data210 Questions
Exam 3: Numerical Descriptive Measures153 Questions
Exam 4: Basic Probability171 Questions
Exam 5: Discrete Probability Distributions218 Questions
Exam 6: The Normal Distribution and Other Continuous Distributions191 Questions
Exam 7: Sampling and Sampling Distributions197 Questions
Exam 8: Confidence Interval Estimation196 Questions
Exam 9: Fundamentals of Hypothesis Testing: One-Sample Tests165 Questions
Exam 10: Two-Sample Tests210 Questions
Exam 11: Analysis of Variance213 Questions
Exam 12: Chi-Square Tests and Nonparametric Tests201 Questions
Exam 13: Simple Linear Regression213 Questions
Exam 14: Introduction to Multiple Regression355 Questions
Exam 15: Multiple Regression Model Building96 Questions
Exam 16: Time-Series Forecasting168 Questions
Exam 17: Statistical Applications in Quality Management133 Questions
Exam 18: A Roadmap for Analyzing Data54 Questions
Exam 19: Questions that Involve Online Topics321 Questions
Select questions type
TABLE 3-3
The ordered array below represents the number of vitamin supplements sold by a health food store in a sample of 16 days.
19,19,20,20,22,23,25,26,27,30,33,34,35,36,38,41
Note: For this sample,the sum of the values is 448,and the sum of the squared differences between each value and the mean is 812.
-Referring to Table 3-3,construct a boxplot for the data in this sample.
(Essay)
4.8/5  (43)
(43)
TABLE 3-4
The ordered array below represents the number of cargo manifests approved by customs inspectors of the Port of New York in a sample of 35 days:
16,17,18,18,19,20,20,21,21,21,22,22,22,22,23,23,23,23,24,24,24,25,25,26,26,26,27,28,28,29,29,31,31,32,32
Note: For this sample,the sum of the values is 838,and the sum of the squared differences between each value and the mean is 619.89.
-Referring to Table 3-4,the variance of the customs data is ________.
(Short Answer)
4.8/5 (33)
TABLE 3-6
The rates of return of an Internet Service Provider over a 10 year period are: 10.25%,12.64%,8.37%,9.29%,6.23%,42.53%,29.23%,15.25%,21.52%,-2.35%.
-The rate of return for a stock over a three year period is 0.527,0.145,and 0.684.The geometric mean rate of return is ________.
(Short Answer)
4.9/5 (28)
Which of the following statements about the median is not true?
(Multiple Choice)
4.9/5 (39)
In left-skewed distributions,which of the following is the correct statement?
(Multiple Choice)
4.8/5 (31)
The interquartile range is a measure of central tendency in a set of data.
(True/False)
4.9/5 (42)
Which of the following is not a measure of central tendency?
(Multiple Choice)
4.8/5 (38)
According to the Chebyshev rule,at least what percentage of the observations in any data set are contained within a distance of 3 standard deviations around the mean?
(Multiple Choice)
4.9/5 (45)
Data on the change in the cost of tuition,a shared dormitory room,and the most popular meal plan from one academic year to the next academic year for a sample of 100 public universities are collected.Below is the boxplot for the change in cost in dollars.The distribution of the change in cost is 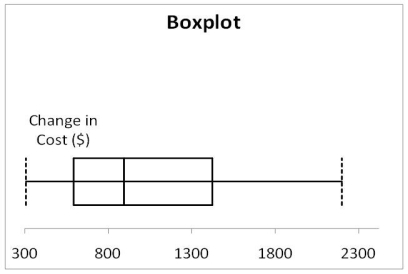
(Multiple Choice)
4.8/5 (33)
TABLE 3-13
Energy drink consumption has continued to gain in popularity since the 1997 debut of Red Bull,the current leader in the energy drink market.Given below are the exam scores and the number of 12-ounce energy drinks consumed within a week prior to the exam of 10 college students.
 -Referring to Table 3-13,what is the sample correlation coefficient between the exam scores and the number of energy drinks consumed?
(Short Answer)
4.9/5 (31)
TABLE 3-6
The rates of return of an Internet Service Provider over a 10 year period are: 10.25%,12.64%,8.37%,9.29%,6.23%,42.53%,29.23%,15.25%,21.52%,-2.35%.
-Referring to Table 3-6,compute the arithmetic mean rate of return per year.
(Short Answer)
4.9/5 (37)
According to the empirical rule,if the data form a "bell-shaped" normal distribution,________ percent of the observations will be contained within 1 standard deviation around the arithmetic mean.
(Multiple Choice)
4.8/5 (41)
TABLE 3-7
In a recent academic year,many public universities in the United States raised tuition and fees due to a decrease in state subsidies.The change in the cost of tuition,a shared dormitory room,and the most popular meal plan from the previous academic year for a sample of 10 public universities were as follows: $1,589,$593,$1,223,$869,$423,$1,720,$708,$1425,$922 and $308.
-Referring to Table 3-7,what is the mean and median change in the cost?
(Short Answer)
4.8/5 (39)
TABLE 3-2
The data below represent the amount of grams of carbohydrates in a serving of breakfast cereal in a sample of 11 different servings.
11 15 23 29 19 22 21 20 15 25 17
-Referring to Table 3-2,the arithmetic mean carbohydrates in this sample is ________ grams.
(Short Answer)
4.8/5 (39)
TABLE 3-3
The ordered array below represents the number of vitamin supplements sold by a health food store in a sample of 16 days.
19,19,20,20,22,23,25,26,27,30,33,34,35,36,38,41
Note: For this sample,the sum of the values is 448,and the sum of the squared differences between each value and the mean is 812.
-Referring to Table 3-3,what type of shape does the distribution of the sample appear to have?
(Essay)
4.7/5 (39)
TABLE 3-6
The rates of return of an Internet Service Provider over a 10 year period are: 10.25%,12.64%,8.37%,9.29%,6.23%,42.53%,29.23%,15.25%,21.52%,-2.35%.
-The Z score of a value measures how many standard deviations the value is from the mean.
(True/False)
4.8/5 (37)
The coefficient of variation is a measure of central tendency in the data.
(True/False)
4.9/5 (41)
TABLE 3-7
In a recent academic year,many public universities in the United States raised tuition and fees due to a decrease in state subsidies.The change in the cost of tuition,a shared dormitory room,and the most popular meal plan from the previous academic year for a sample of 10 public universities were as follows: $1,589,$593,$1,223,$869,$423,$1,720,$708,$1425,$922 and $308.
-Referring to Table 3-7,what are the (absolute values of)the Z scores of the change in cost?
(Essay)
4.7/5 (39)
TABLE 3-6
The rates of return of an Internet Service Provider over a 10 year period are: 10.25%,12.64%,8.37%,9.29%,6.23%,42.53%,29.23%,15.25%,21.52%,-2.35%.
-The Z scores can be used to identify outliers.
(True/False)
4.9/5 (40)
Filters
- Essay(0)
- Multiple Choice(0)
- Short Answer(0)
- True False(0)
- Matching(0)