Exam 16: Time-Series Forecasting
Exam 1: Introduction145 Questions
Exam 2: Organizing and Visualizing Data210 Questions
Exam 3: Numerical Descriptive Measures153 Questions
Exam 4: Basic Probability171 Questions
Exam 5: Discrete Probability Distributions218 Questions
Exam 6: The Normal Distribution and Other Continuous Distributions191 Questions
Exam 7: Sampling and Sampling Distributions197 Questions
Exam 8: Confidence Interval Estimation196 Questions
Exam 9: Fundamentals of Hypothesis Testing: One-Sample Tests165 Questions
Exam 10: Two-Sample Tests210 Questions
Exam 11: Analysis of Variance213 Questions
Exam 12: Chi-Square Tests and Nonparametric Tests201 Questions
Exam 13: Simple Linear Regression213 Questions
Exam 14: Introduction to Multiple Regression355 Questions
Exam 15: Multiple Regression Model Building96 Questions
Exam 16: Time-Series Forecasting168 Questions
Exam 17: Statistical Applications in Quality Management133 Questions
Exam 18: A Roadmap for Analyzing Data54 Questions
Exam 19: Questions that Involve Online Topics321 Questions
Select questions type
TABLE 16-4
The number of cases of merlot wine sold by a Paso Robles winery in an 8-year period follows. 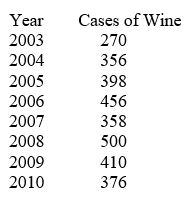 -Referring to Table 16-4,a centered 3-year moving average is to be constructed for the wine sales.The moving average for 2004 is ________.
(Short Answer)
4.9/5  (38)
(38)
TABLE 16-5
The number of passengers arriving at San Francisco on the Amtrak cross-country express on 6 successive Mondays were: 60,72,96,84,36,and 48.
-Referring to Table 16-5,the number of arrivals will be smoothed with a 3-term moving average.There will be a total of ________ smoothed values.
(Short Answer)
4.8/5 (37)
The annual multiplicative time-series model does not possess ________ component.
(Multiple Choice)
4.8/5 (34)
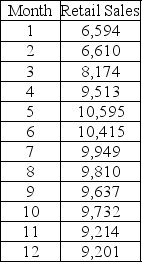
TABLE 16-13
Given below is the monthly time-series data for U.S.retail sales of building materials over a specific year.
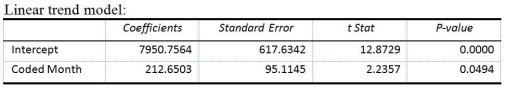
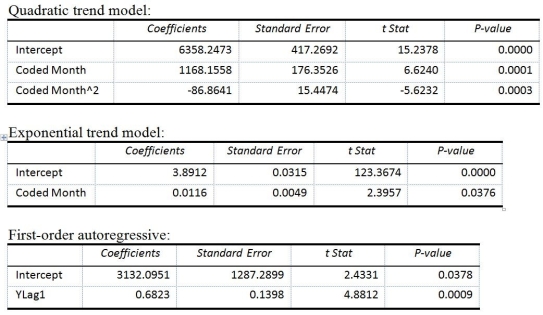
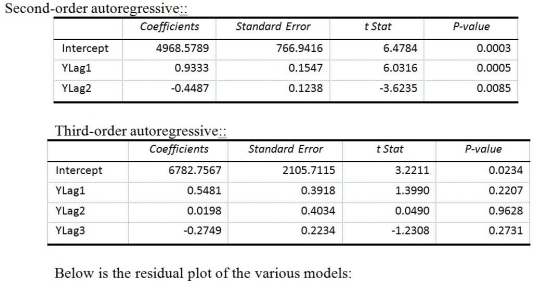
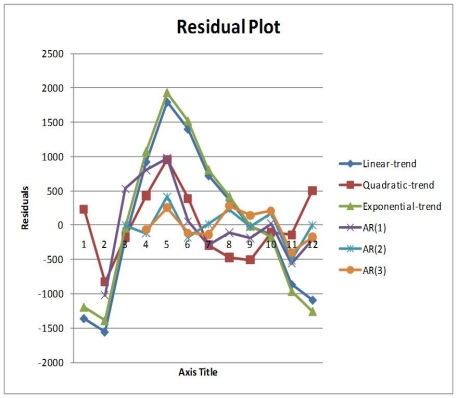
 The results of the linear trend,quadratic trend,exponential trend,first-order autoregressive,second-order autoregressive and third-order autoregressive model are presented below in which the coded month for the first month is 0:
 -Referring to Table 16-13,if a five-month moving average is used to smooth this series,what would be the last calculated value?
(Short Answer)
4.8/5 (35)
TABLE 16-13
Given below is the monthly time-series data for U.S.retail sales of building materials over a specific year.
The results of the linear trend,quadratic trend,exponential trend,first-order autoregressive,second-order autoregressive and third-order autoregressive model are presented below in which the coded month for the first month is 0:
-Referring to Table 16-13,you can reject the null hypothesis for testing the appropriateness of the third-order autoregressive model at the 5% level of significance.
(True/False)
4.8/5 (36)
After estimating a trend model for annual time-series data,you obtain the following residual plot against time. 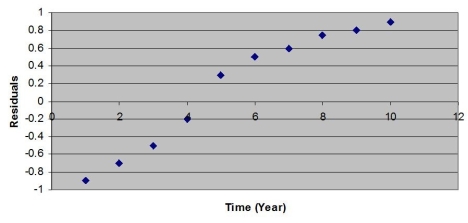 The problem with your model is that
(Multiple Choice)
4.8/5 (40)
TABLE 16-12
A local store developed a multiplicative time-series model to forecast its revenues in future quarters,using quarterly data on its revenues during the 4-year period from 2005 to 2009.The following is the resulting regression equation:
log₁₀  = 6.102 + 0.012 X - 0.129 Q₁ - 0.054 Q₂ + 0.098 Q₃
where
= 6.102 + 0.012 X - 0.129 Q₁ - 0.054 Q₂ + 0.098 Q₃
where  is the estimated number of contracts in a quarter.
X is the coded quarterly value with X = 0 in the first quarter of 2005.
Q₁ is a dummy variable equal to 1 in the first quarter of a year and 0 otherwise.
Q₂ is a dummy variable equal to 1 in the second quarter of a year and 0 otherwise.
Q₃ is a dummy variable equal to 1 in the third quarter of a year and 0 otherwise.
-Referring to Table 16-12,the best interpretation of the coefficient of Q₃ (0.098)in the regression equation is
is the estimated number of contracts in a quarter.
X is the coded quarterly value with X = 0 in the first quarter of 2005.
Q₁ is a dummy variable equal to 1 in the first quarter of a year and 0 otherwise.
Q₂ is a dummy variable equal to 1 in the second quarter of a year and 0 otherwise.
Q₃ is a dummy variable equal to 1 in the third quarter of a year and 0 otherwise.
-Referring to Table 16-12,the best interpretation of the coefficient of Q₃ (0.098)in the regression equation is
(Multiple Choice)
4.7/5 (34)
TABLE 16-14
A contractor developed a multiplicative time-series model to forecast the number of contracts in future quarters,using quarterly data on number of contracts during the 3-year period from 2008 to 2010.The following is the resulting regression equation:
ln Ŷ = 3.37 + 0.117 X - 0.083 Q₁ + 1.28 Q₂ + 0.617 Q₃
where Ŷ is the estimated number of contracts in a quarter
X is the coded quarterly value with X = 0 in the first quarter of 2008.
Q₁ is a dummy variable equal to 1 in the first quarter of a year and 0 otherwise.
Q₂ is a dummy variable equal to 1 in the second quarter of a year and 0 otherwise.
Q₃ is a dummy variable equal to 1 in the third quarter of a year and 0 otherwise.
-Referring to Table 16-14,using the regression equation,which of the following values is the best forecast for the number of contracts in the second quarter of 2012?
(Multiple Choice)
4.8/5 (42)
TABLE 16-14
A contractor developed a multiplicative time-series model to forecast the number of contracts in future quarters,using quarterly data on number of contracts during the 3-year period from 2008 to 2010.The following is the resulting regression equation:
ln Ŷ = 3.37 + 0.117 X - 0.083 Q₁ + 1.28 Q₂ + 0.617 Q₃
where Ŷ is the estimated number of contracts in a quarter
X is the coded quarterly value with X = 0 in the first quarter of 2008.
Q₁ is a dummy variable equal to 1 in the first quarter of a year and 0 otherwise.
Q₂ is a dummy variable equal to 1 in the second quarter of a year and 0 otherwise.
Q₃ is a dummy variable equal to 1 in the third quarter of a year and 0 otherwise.
-Referring to Table 16-14,to obtain a forecast for the fourth quarter of 2011 using the model,which of the following sets of values should be used in the regression equation?
(Multiple Choice)
4.8/5 (37)
TABLE 16-12
A local store developed a multiplicative time-series model to forecast its revenues in future quarters,using quarterly data on its revenues during the 4-year period from 2005 to 2009.The following is the resulting regression equation:
log₁₀ = 6.102 + 0.012 X - 0.129 Q₁ - 0.054 Q₂ + 0.098 Q₃
where is the estimated number of contracts in a quarter.
X is the coded quarterly value with X = 0 in the first quarter of 2005.
Q₁ is a dummy variable equal to 1 in the first quarter of a year and 0 otherwise.
Q₂ is a dummy variable equal to 1 in the second quarter of a year and 0 otherwise.
Q₃ is a dummy variable equal to 1 in the third quarter of a year and 0 otherwise.
-Referring to Table 16-12,using the regression equation,what is the forecast for the revenues in the fourth quarter of 2011?
(Short Answer)
4.9/5 (40)
The effect of an unpredictable,rare event will be contained in the ________ component.
(Multiple Choice)
4.7/5 (37)
TABLE 16-4
The number of cases of merlot wine sold by a Paso Robles winery in an 8-year period follows.
-Referring to Table 16-4,a centered 5-year moving average is to be constructed for the wine sales.The moving average for 2005 is ________.
(Short Answer)
5.0/5 (30)
TABLE 16-11
The manager of a health club has recorded mean attendance in newly introduced step classes over the last 15 months: 32.1,39.5,40.3,46.0,65.2,73.1,83.7,106.8,118.0,133.1,163.3,182.8,205.6,249.1,and 263.5.She then used Microsoft Excel to obtain the following partial output for both a first- and second-order autoregressive model.
SUMMARY OUTPUT - 2ⁿᵈ Order Model
Regression Statistics
Multiple R 0.993
R Square 0.987
Adjusted R Square 0.985
Standard Error 9.276
Observations 15
Coefficients
Intercept 5.86
X Variable 1 0.37
X Variable 2 0.85
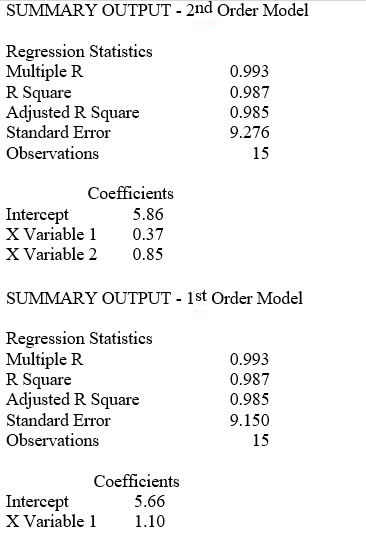 -Referring to Table 16-11,using the second-order model,the forecast of mean attendance for month 16 is ________.
(Short Answer)
4.8/5 (42)
TABLE 16-13
Given below is the monthly time-series data for U.S.retail sales of building materials over a specific year.
The results of the linear trend,quadratic trend,exponential trend,first-order autoregressive,second-order autoregressive and third-order autoregressive model are presented below in which the coded month for the first month is 0:
-Referring to Table 16-13,the best model based on the residual plots is the linear-trend model.
(True/False)
4.8/5 (42)
TABLE 16-5
The number of passengers arriving at San Francisco on the Amtrak cross-country express on 6 successive Mondays were: 60,72,96,84,36,and 48.
-Referring to Table 16-5,the number of arrivals will be exponentially smoothed with a smoothing constant of 0.25.The smoothed value for the second Monday will be ________.
(Short Answer)
4.8/5 (38)
TABLE 16-2
The monthly advertising expenditures of a department store chain (in $1,000,000s)were collected over the last decade.The last 14 months of this time series follows:
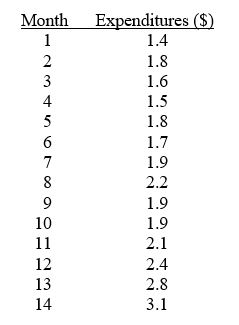 -Referring to Table 16-2,advertising expenditures appear to be increasing in a linear rather than curvilinear manner over time.
(True/False)
4.9/5 (36)
TABLE 16-13
Given below is the monthly time-series data for U.S.retail sales of building materials over a specific year.
The results of the linear trend,quadratic trend,exponential trend,first-order autoregressive,second-order autoregressive and third-order autoregressive model are presented below in which the coded month for the first month is 0:
-Referring to Table 16-13,what is your forecast for the 13ᵗʰ month using the third-order autoregressive model?
(Short Answer)
4.9/5 (40)
TABLE 16-5
The number of passengers arriving at San Francisco on the Amtrak cross-country express on 6 successive Mondays were: 60,72,96,84,36,and 48.
-Referring to Table 16-5,the number of arrivals will be exponentially smoothed with a smoothing constant of 0.1.The smoothed value for the second Monday will be ________.
(Short Answer)
4.8/5 (32)
TABLE 16-14
A contractor developed a multiplicative time-series model to forecast the number of contracts in future quarters,using quarterly data on number of contracts during the 3-year period from 2008 to 2010.The following is the resulting regression equation:
ln Ŷ = 3.37 + 0.117 X - 0.083 Q₁ + 1.28 Q₂ + 0.617 Q₃
where Ŷ is the estimated number of contracts in a quarter
X is the coded quarterly value with X = 0 in the first quarter of 2008.
Q₁ is a dummy variable equal to 1 in the first quarter of a year and 0 otherwise.
Q₂ is a dummy variable equal to 1 in the second quarter of a year and 0 otherwise.
Q₃ is a dummy variable equal to 1 in the third quarter of a year and 0 otherwise.
-Referring to Table 16-14,the best interpretation of the constant 3.37 in the regression equation is
(Multiple Choice)
4.9/5 (39)
Microsoft Excel was used to obtain the following quadratic trend equation:
Sales = 100 - 10X + 15X².
The data used was from 2001 through 2010 coded 0 to 9.The forecast for 2011 is ________.
(Short Answer)
4.8/5 (31)
Filters
- Essay(0)
- Multiple Choice(0)
- Short Answer(0)
- True False(0)
- Matching(0)