Exam 16: Time-Series Forecasting
Exam 1: Introduction145 Questions
Exam 2: Organizing and Visualizing Data210 Questions
Exam 3: Numerical Descriptive Measures153 Questions
Exam 4: Basic Probability171 Questions
Exam 5: Discrete Probability Distributions218 Questions
Exam 6: The Normal Distribution and Other Continuous Distributions191 Questions
Exam 7: Sampling and Sampling Distributions197 Questions
Exam 8: Confidence Interval Estimation196 Questions
Exam 9: Fundamentals of Hypothesis Testing: One-Sample Tests165 Questions
Exam 10: Two-Sample Tests210 Questions
Exam 11: Analysis of Variance213 Questions
Exam 12: Chi-Square Tests and Nonparametric Tests201 Questions
Exam 13: Simple Linear Regression213 Questions
Exam 14: Introduction to Multiple Regression355 Questions
Exam 15: Multiple Regression Model Building96 Questions
Exam 16: Time-Series Forecasting168 Questions
Exam 17: Statistical Applications in Quality Management133 Questions
Exam 18: A Roadmap for Analyzing Data54 Questions
Exam 19: Questions that Involve Online Topics321 Questions
Select questions type
TABLE 16-4
The number of cases of merlot wine sold by a Paso Robles winery in an 8-year period follows. 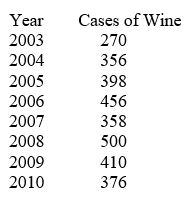 -Referring to Table 16-4,a centered 3-year moving average is to be constructed for the wine sales.The moving average for 2007 is ________.
(Short Answer)
4.7/5  (39)
(39)
TABLE 16-10
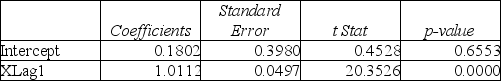
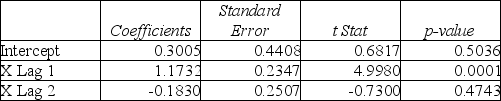
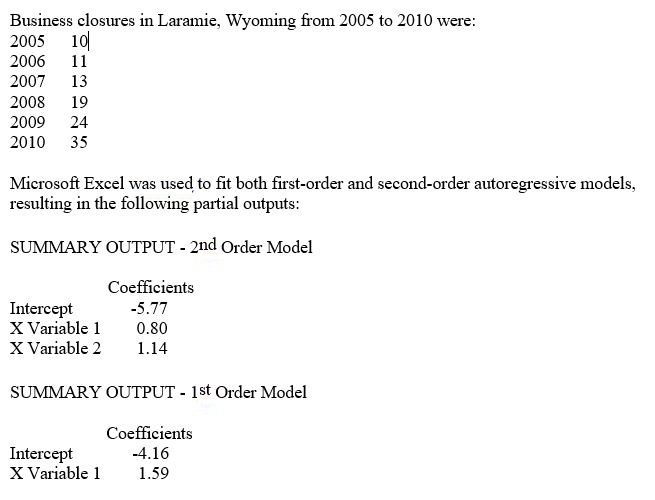 -Referring to Table 16-10,the residuals for the first-order autoregressive model are ________,________,________,________,and ________.
(Short Answer)
4.8/5 (37)
When using the exponentially weighted moving average for purposes of forecasting rather than smoothing,
(Multiple Choice)
4.9/5 (35)
TABLE 16-8
The manager of a marketing consulting firm has been examining his company's yearly profits.He believes that these profits have been showing a quadratic trend since 1990.He uses Microsoft Excel to obtain the partial output below.The dependent variable is profit (in thousands of dollars),while the independent variables are coded years and squared of coded years,where 1990 is coded as 0,1991 is coded as 1,etc.
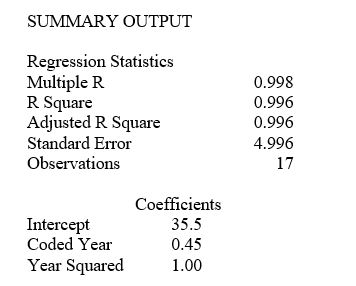 -Referring to Table 16-8,the forecast for profits in 2015 is ________.
(Short Answer)
4.8/5 (36)
TABLE 16-4
The number of cases of merlot wine sold by a Paso Robles winery in an 8-year period follows.
-Referring to Table 16-4,exponential smoothing with a weight or smoothing constant of 0.4 will be used to smooth the wine sales.The value of E₂,the smoothed value for 2004 is ________.
(Short Answer)
4.9/5 (34)
TABLE 16-7
The executive vice-president of a drug manufacturing firm believes that the demand for the firm's most popular drug has been evidencing an exponential trend since 1995.She uses Microsoft Excel to obtain the partial output below.The dependent variable is the log base 10 of the demand for the drug,while the independent variable is years,where 1995 is coded as 0,1996 is coded as 1,etc.
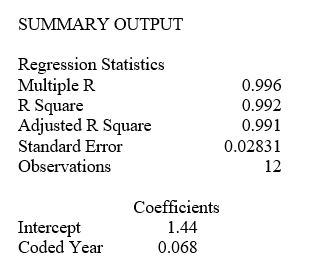 -Referring to Table 16-7,the fitted exponential trend equation to predict Y is ________.
(Short Answer)
4.8/5 (32)
TABLE 16-6
The president of a chain of department stores believes that her stores' total sales have been showing a linear trend since 1990.She uses Microsoft Excel to obtain the partial output below.The dependent variable is sales (in millions of dollars),while the independent variable is coded years,where 1990 is coded as 0,1991 is coded as 1,etc.
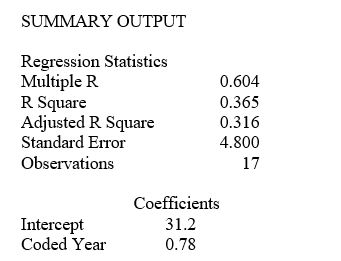 -Referring to Table 16-6,the forecast for sales (in millions of dollars)in 2015 is ________.
(Short Answer)
4.9/5 (29)
TABLE 16-13
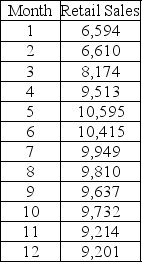
Given below is the monthly time-series data for U.S.retail sales of building materials over a specific year.
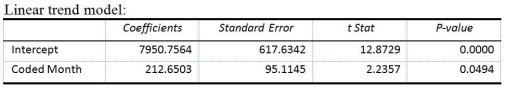
 The results of the linear trend,quadratic trend,exponential trend,first-order autoregressive,second-order autoregressive and third-order autoregressive model are presented below in which the coded month for the first month is 0:
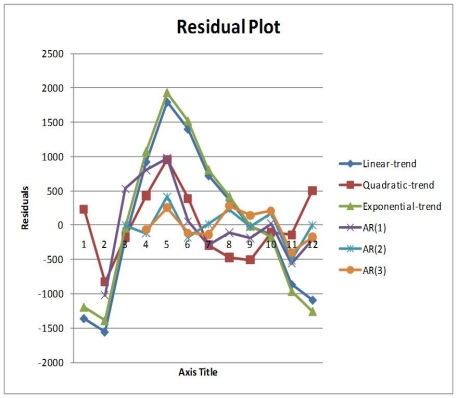 -Referring to Table 16-13,if a five-month moving average is used to smooth this series,what would be the first calculated value?
(Short Answer)
4.9/5 (36)
TABLE 16-7
The executive vice-president of a drug manufacturing firm believes that the demand for the firm's most popular drug has been evidencing an exponential trend since 1995.She uses Microsoft Excel to obtain the partial output below.The dependent variable is the log base 10 of the demand for the drug,while the independent variable is years,where 1995 is coded as 0,1996 is coded as 1,etc.
-Referring to Table 16-7,the fitted trend value for 1995 is ________.
(Short Answer)
4.8/5 (36)
TABLE 16-14
A contractor developed a multiplicative time-series model to forecast the number of contracts in future quarters,using quarterly data on number of contracts during the 3-year period from 2008 to 2010.The following is the resulting regression equation:
ln Ŷ = 3.37 + 0.117 X - 0.083 Q₁ + 1.28 Q₂ + 0.617 Q₃
where Ŷ is the estimated number of contracts in a quarter
X is the coded quarterly value with X = 0 in the first quarter of 2008.
Q₁ is a dummy variable equal to 1 in the first quarter of a year and 0 otherwise.
Q₂ is a dummy variable equal to 1 in the second quarter of a year and 0 otherwise.
Q₃ is a dummy variable equal to 1 in the third quarter of a year and 0 otherwise.
-Referring to Table 16-14,in testing the coefficient of X in the regression equation (0.117)the results were a t-statistic of 9.08 and an associated p-value of 0.0000.Which of the following is the best interpretation of this result?
(Multiple Choice)
4.9/5 (42)
Which of the following terms describes the overall long-term tendency of a time series?
(Multiple Choice)
4.8/5 (35)
The method of least squares may be used to estimate both linear and curvilinear trends.
(True/False)
4.8/5 (34)
In selecting an appropriate forecasting model,the following approach is suggested.
(Multiple Choice)
4.9/5 (43)
TABLE 16-9
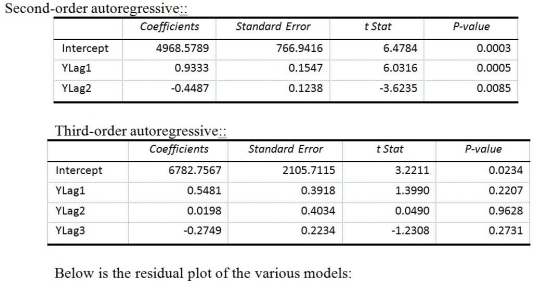
Given below are Excel outputs for various estimated autoregressive models for a company's real operating revenues (in billions of dollars)from 1985 to 2008.From the data,you also know that the real operating revenues for 2006,2007,and 2008 are 11.7909,11.7757 and 11.5537,respectively.
First-Order Autoregressive Model:
 Second-Order Autoregressive Model:
 Third-Order Autoregressive Model:
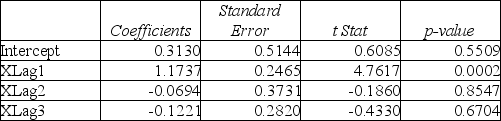 -Referring to Table 16-9,if one decides to use the Third-Order Autoregressive model,what will the predicted real operating revenue for the company be in 2011?
(Multiple Choice)
5.0/5 (33)
TABLE 16-13
Given below is the monthly time-series data for U.S.retail sales of building materials over a specific year.
The results of the linear trend,quadratic trend,exponential trend,first-order autoregressive,second-order autoregressive and third-order autoregressive model are presented below in which the coded month for the first month is 0:
-Referring to Table 16-13,what is your forecast for the 13ᵗʰ month using the linear-trend model?
(Short Answer)
4.7/5 (39)
TABLE 16-3
The following table contains the number of complaints received in a department store for the first 6 months of last year. 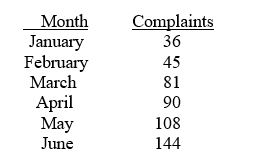 -Referring to Table 16-3,if a three-month moving average is used to smooth this series,what would be the last calculated value?
(Multiple Choice)
4.7/5 (34)
TABLE 16-5
The number of passengers arriving at San Francisco on the Amtrak cross-country express on 6 successive Mondays were: 60,72,96,84,36,and 48.
-Referring to Table 16-5,the number of arrivals will be smoothed with a 5-term moving average.The first smoothed value will be ________.
(Short Answer)
4.9/5 (41)
If you want to recover the trend using exponential smoothing,you will choose a weight (W)that falls in the range
(Multiple Choice)
4.8/5 (38)
TABLE 16-10
-Referring to Table 16-10,the fitted values for the first-order autoregressive model are ________,________,________,________,and ________.
(Essay)
4.9/5 (39)
Filters
- Essay(0)
- Multiple Choice(0)
- Short Answer(0)
- True False(0)
- Matching(0)