Exam 17: Statistical Applications in Quality Management
Exam 1: Introduction145 Questions
Exam 2: Organizing and Visualizing Data210 Questions
Exam 3: Numerical Descriptive Measures153 Questions
Exam 4: Basic Probability171 Questions
Exam 5: Discrete Probability Distributions218 Questions
Exam 6: The Normal Distribution and Other Continuous Distributions191 Questions
Exam 7: Sampling and Sampling Distributions197 Questions
Exam 8: Confidence Interval Estimation196 Questions
Exam 9: Fundamentals of Hypothesis Testing: One-Sample Tests165 Questions
Exam 10: Two-Sample Tests210 Questions
Exam 11: Analysis of Variance213 Questions
Exam 12: Chi-Square Tests and Nonparametric Tests201 Questions
Exam 13: Simple Linear Regression213 Questions
Exam 14: Introduction to Multiple Regression355 Questions
Exam 15: Multiple Regression Model Building96 Questions
Exam 16: Time-Series Forecasting168 Questions
Exam 17: Statistical Applications in Quality Management133 Questions
Exam 18: A Roadmap for Analyzing Data54 Questions
Exam 19: Questions that Involve Online Topics321 Questions
Select questions type
In the United States,the control limits on a control chart are placed so that they are 3 standard deviations above and below a central line.
(True/False)
4.8/5  (32)
(32)
TABLE 17-8
Recently,a university switched to a new type of computer-based registration.The registrar is concerned with the amount of time students are spending on the computer registering under the new system.She decides to randomly select 8 students on each of the 12 days of the registration and determine the time each spends on the computer registering.The range,mean,and standard deviation of the times required to register are in the table that follows.
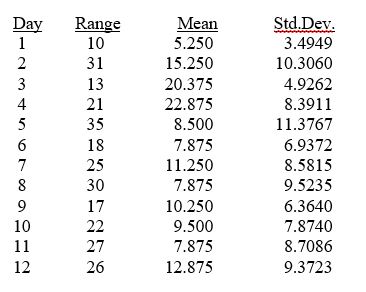 -Referring to Table 17-8,based on the
  chart,it appears that the process is in control.
(True/False)
4.9/5 (41)
TABLE 17-4
A factory supervisor is concerned that the time it takes workers to complete an important production task (measured in seconds)is too erratic and adversely affects expected profits.The supervisor proceeds by randomly sampling 5 individuals per hour for a period of 10 hours.The sample mean and range for each hour are listed below.
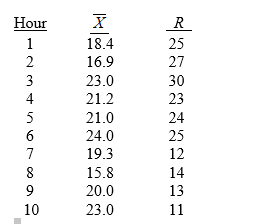 She also decides that lower and upper specification limit for the critical-to-quality variable should be 10 and 30 seconds, respectively.
-Referring to Table 17-4,suppose the supervisor constructs an
She also decides that lower and upper specification limit for the critical-to-quality variable should be 10 and 30 seconds, respectively.
-Referring to Table 17-4,suppose the supervisor constructs an  chart to see if the process is in-control.Which expression best describes this chart?
(Multiple Choice)
4.8/5 (25)
TABLE 17-3
A quality control analyst for a light bulb manufacturer is concerned that the time it takes to produce a batch of light bulbs is too erratic.Accordingly,the analyst randomly surveys 10 production periods each day for 14 days and records the sample mean and range for each day.
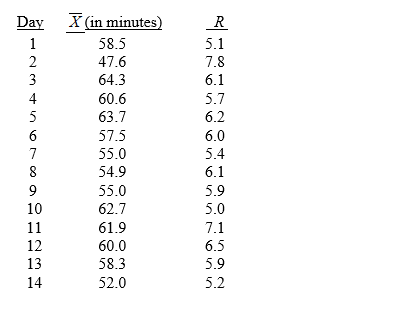 -Referring to Table 17-3,suppose the analyst constructs an R chart to see if the variability in production times is in-control.What is the upper control limit for this R chart?
(Multiple Choice)
5.0/5 (40)
Cp > 1 indicates that if the process average can be centered,then more than 99.73% of the observations will fall inside the specification limits.
(True/False)
4.9/5 (32)
TABLE 17-1
A local newspaper has 10 delivery boys who each deliver the morning paper to 50 customers every day.The owner decides to record the number of papers delivered on time for a 10-day period for one of the delivery boys and construct a p chart to see whether the percentage is too erratic.
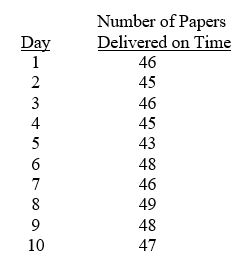 -Referring to Table 17-1,which expression best characterizes the p chart?
(Multiple Choice)
4.8/5 (28)
Which of the following is not part of the DMAIC process in Six Sigma management?
(Multiple Choice)
5.0/5 (34)
The Shewhart-Deming cycle plays an important role in which of the following Deming's 14 points for management?
(Multiple Choice)
4.7/5 (36)
TABLE 17-9
The manufacturer of canned food constructed control charts and analyzed several quality characteristics.One characteristic of interest is the weight of the filled cans.The lower specification limit for weight is 2.95 pounds.The table below provides the range and mean of the weights of five cans tested every fifteen minutes during a day's production.
 -Referring to Table 17-9,an R chart is to be constructed for the weight.The upper control limit for this data set is ________.
(Short Answer)
4.8/5 (38)
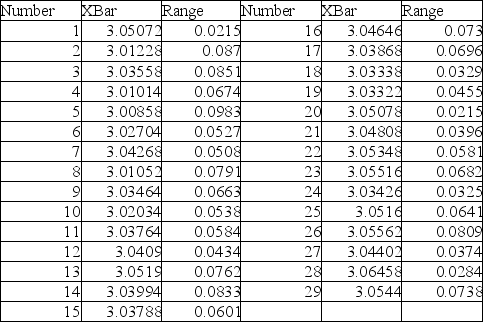
TABLE 17-7
A supplier of silicone sheets for producers of computer chips wants to evaluate her manufacturing process.She takes samples of size 5 from each day's output and counts the number of blemishes on each silicone sheet.The results from 20 days of such evaluations are presented below. 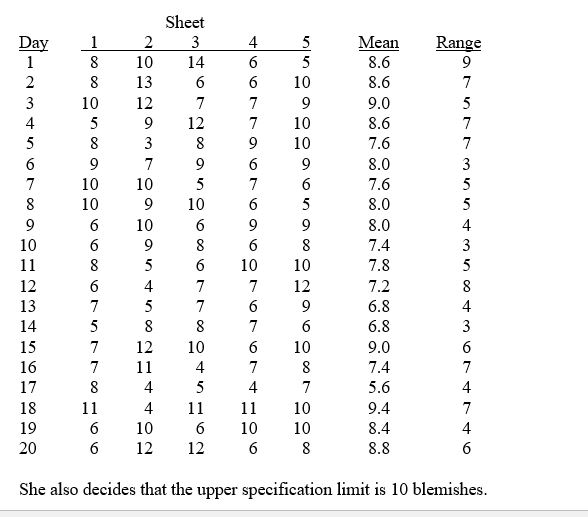 -Referring to Table 17-7,what is the value of the CPU index?
(Short Answer)
4.7/5 (28)
TABLE 17-10
Below is the number of defective items from a production line over twenty consecutive morning shifts.
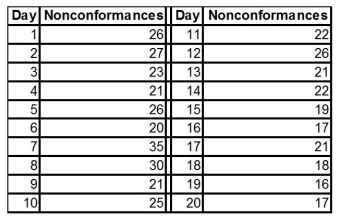 -Referring to Table 17-10,construct a c chart for the number of defective items.
(Essay)
4.9/5 (34)
TABLE 17-6
The maker of a packaged candy wants to evaluate the quality of her production process.On each of 16 consecutive days,she samples 600 bags of candy and determines the number in each day's sample that she considers to be of poor quality.The data that she developed follow. 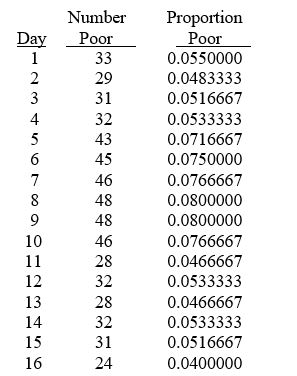 -Referring to Table 17-6,a p control chart is to be constructed for these data.The estimate of the standard error of the sample proportion is ________.
(Short Answer)
4.7/5 (24)
TABLE 17-6
The maker of a packaged candy wants to evaluate the quality of her production process.On each of 16 consecutive days,she samples 600 bags of candy and determines the number in each day's sample that she considers to be of poor quality.The data that she developed follow.
-Referring to Table 17-6,the process seems to be in control.
(True/False)
4.9/5 (35)
TABLE 17-7
A supplier of silicone sheets for producers of computer chips wants to evaluate her manufacturing process.She takes samples of size 5 from each day's output and counts the number of blemishes on each silicone sheet.The results from 20 days of such evaluations are presented below.
-Referring to Table 17-7,based on the R chart,it appears that the process is out of control.
(True/False)
4.9/5 (34)
TABLE 17-4
A factory supervisor is concerned that the time it takes workers to complete an important production task (measured in seconds)is too erratic and adversely affects expected profits.The supervisor proceeds by randomly sampling 5 individuals per hour for a period of 10 hours.The sample mean and range for each hour are listed below.
She also decides that lower and upper specification limit for the critical-to-quality variable should be 10 and 30 seconds, respectively.
-Referring to Table 17-4,what is the value of the CPU index?
(Short Answer)
4.8/5 (34)
TABLE 17-4
A factory supervisor is concerned that the time it takes workers to complete an important production task (measured in seconds)is too erratic and adversely affects expected profits.The supervisor proceeds by randomly sampling 5 individuals per hour for a period of 10 hours.The sample mean and range for each hour are listed below.
She also decides that lower and upper specification limit for the critical-to-quality variable should be 10 and 30 seconds, respectively.
-Referring to Table 17-4,suppose the supervisor constructs an R chart to see if the variability in collection times is in-control.This R chart is characterized by which of the following?
(Multiple Choice)
4.8/5 (33)
Which of the following is a method for breaking process into a series of steps in order to eliminate defects and produce near perfect results?
(Multiple Choice)
4.8/5 (40)
The p chart is a control chart used for monitoring the proportion of items that meet given specifications.
(True/False)
4.8/5 (35)
TABLE 17-5
A manufacturer of computer disks took samples of 240 disks on 15 consecutive days.The number of disks with bad sectors was determined for each of these samples.The results are in the table that follows.
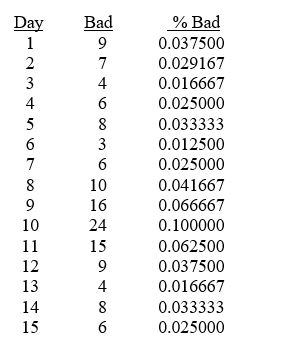 -Referring to Table 17-5,a p control chart is to be made for these data.The upper control limit is ________,and the lower control limit is ________.
(Short Answer)
4.8/5 (38)
Filters
- Essay(0)
- Multiple Choice(0)
- Short Answer(0)
- True False(0)
- Matching(0)