Exam 19: Questions that Involve Online Topics
Exam 1: Introduction145 Questions
Exam 2: Organizing and Visualizing Data210 Questions
Exam 3: Numerical Descriptive Measures153 Questions
Exam 4: Basic Probability171 Questions
Exam 5: Discrete Probability Distributions218 Questions
Exam 6: The Normal Distribution and Other Continuous Distributions191 Questions
Exam 7: Sampling and Sampling Distributions197 Questions
Exam 8: Confidence Interval Estimation196 Questions
Exam 9: Fundamentals of Hypothesis Testing: One-Sample Tests165 Questions
Exam 10: Two-Sample Tests210 Questions
Exam 11: Analysis of Variance213 Questions
Exam 12: Chi-Square Tests and Nonparametric Tests201 Questions
Exam 13: Simple Linear Regression213 Questions
Exam 14: Introduction to Multiple Regression355 Questions
Exam 15: Multiple Regression Model Building96 Questions
Exam 16: Time-Series Forecasting168 Questions
Exam 17: Statistical Applications in Quality Management133 Questions
Exam 18: A Roadmap for Analyzing Data54 Questions
Exam 19: Questions that Involve Online Topics321 Questions
Select questions type
TABLE 16-1
Given below are the average prices for three types of energy products for five consecutive years.
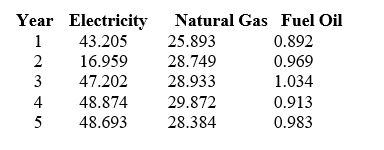 -Referring to Table 16-1,what are the simple price indices for electricity,natural gas and fuel oil,respectively,in year 5 using year 1 as the base year?
(Short Answer)
5.0/5  (35)
(35)
TABLE 9-1
A manufacturer produces light bulbs that have a mean life of at least 500 hours when the production process is working properly.Based on past experience,the population standard deviation is 50 hours and the light bulb life is normally distributed.The operations manager stops the production process if there is evidence that the population mean light bulb life is below 500 hours.
-Referring to Table 9-1,if you select a sample of 100 light bulbs and are willing to have a level of significance of 0.05,the probability of the operations manager stopping the process when the process is not working properly is ________ if the population mean bulb life is 490 hours.
(Short Answer)
4.8/5 (35)
One of the reasons that a correction for continuity adjustment is needed when approximating the binomial distribution with a normal distribution is because a random variable having a binomial distribution can have only a specified value while a random variable having a normal distribution can take on any values within an interval around that specified value.
(True/False)
4.7/5 (31)
TABLE 9-1
A manufacturer produces light bulbs that have a mean life of at least 500 hours when the production process is working properly.Based on past experience,the population standard deviation is 50 hours and the light bulb life is normally distributed.The operations manager stops the production process if there is evidence that the population mean light bulb life is below 500 hours.
-Referring to Table 9-1,if you select a sample of 100 light bulbs and are willing to have a level of significance of 0.10,the probability of a Type II error is ________ if the population mean bulb life is 490 hours.
(Short Answer)
4.9/5 (30)
TABLE 19-1
The following payoff table shows profits associated with a set of 3 alternatives under 2 possible states of nature. 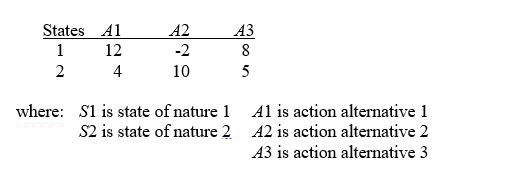 -Blossom's Flowers purchases roses for sale for Valentine's Day.The roses are purchased for $10 a dozen and are sold for $20 a dozen.Any roses not sold on Valentine's Day can be sold for $5 per dozen.The owner will purchase 1 of 3 amounts of roses for Valentine's Day: 100,200,or 400 dozen roses.Given 0.2,0.4,and 0.4 are the probabilities for the sale of 100,200,or 400 dozen roses,respectively,then the optimal alternative using EMV for selling roses is to buy ________ dozen roses.
(Multiple Choice)
4.7/5 (34)
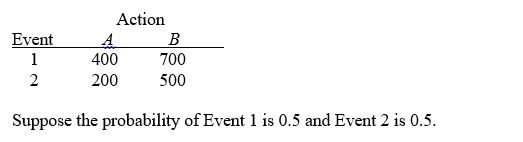
TABLE 19-5
The following payoff table shows profits associated with a set of 2 alternatives under 3 possible events. 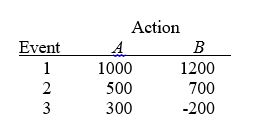 -Referring to Table 19-5,what is the opportunity loss for Action B with Event 1?
(Short Answer)
4.8/5 (33)
To determine the probability of getting at least 3 events of interest in a binomial distribution,you will find the area under the normal curve for X = 2.5 and above.
(True/False)
4.9/5 (36)
The Paasche price index has the disadvantage that current consumption quantities are usually hard to obtain.
(True/False)
4.8/5 (38)
TABLE 16-2
Given below are the prices of a basket of four food items from 2006 to 2010.
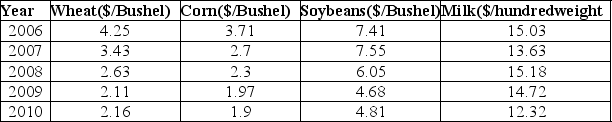 -Referring to Table 16-2,what are the simple price indices for wheat,corn,soybeans and milk,respectively,in 2008 using 2010 as the base year?
(Essay)
4.9/5 (34)
TABLE 19-6
A student wanted to find out the optimal strategy to study for a Business Statistics exam.He constructed the following payoff table based on the mean amount of time he needed to study every week for the course and the degree of difficulty of the exam.From the information that he gathered from students who had taken the course,he concluded that there was a 40% probability that the exam would be easy.
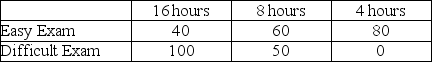 -Referring to Table 19-6,what is the opportunity loss of spending 16 hours per week on average studying for the exam when the exam turns out to be easy?
(Short Answer)
4.8/5 (37)
TABLE 19-6
A student wanted to find out the optimal strategy to study for a Business Statistics exam.He constructed the following payoff table based on the mean amount of time he needed to study every week for the course and the degree of difficulty of the exam.From the information that he gathered from students who had taken the course,he concluded that there was a 40% probability that the exam would be easy.
-Referring to Table 19-6,the optimal strategy using the maximax criterion is to study 8 hours per week on average for the exam.
(True/False)
4.7/5 (44)
Based on past experience,only 0.5% of the invoices of a company contain an error.Out of the 1,500 invoices that the company will issue,what is the approximate probability that more than 4 invoices will contain an error?
(Short Answer)
4.8/5 (40)
TABLE 19-5
The following payoff table shows profits associated with a set of 2 alternatives under 3 possible events.
-Referring to Table 19-5,what is the expected profit under certainty (EPUC)for this problem?
(Short Answer)
5.0/5 (39)
TABLE 8-1
A random sample of 100 stores from a large chain of 500 garden supply stores was selected to determine the mean number of lawnmowers sold at an end-of-season clearance sale.The sample results indicated a mean of 6 and a standard deviation of 2 lawnmowers sold.A 95% confidence interval (5.623 to 6.377)was established based on these results.
-Referring to Table 8-1,the confidence interval estimate of the mean with finite population correction will be wider in range than confidence interval estimate without finite population correction.
(True/False)
4.7/5 (35)
TABLE 19-1
The following payoff table shows profits associated with a set of 3 alternatives under 2 possible states of nature.
-Blossom's Flowers purchases roses for sale for Valentine's Day.The roses are purchased for $10 a dozen and are sold for $20 a dozen.Any roses not sold on Valentine's Day can be sold for $5 per dozen.The owner will purchase 1 of 3 amounts of roses for Valentine's Day: 100,200,or 400 dozen roses.The payoff for buying 200 dozen roses and selling 100 dozen roses at the full price is
(Multiple Choice)
4.8/5 (34)
TABLE 8-1
A random sample of 100 stores from a large chain of 500 garden supply stores was selected to determine the mean number of lawnmowers sold at an end-of-season clearance sale.The sample results indicated a mean of 6 and a standard deviation of 2 lawnmowers sold.A 95% confidence interval (5.623 to 6.377)was established based on these results.
-Referring to Table 8-1,of all possible samples of 100 stores taken from the population of 1,000 stores,95% of the confidence intervals developed will contain the true population mean within the interval.
(True/False)
4.9/5 (42)
The Paasche price index reflects more accurately the consumption cost at a point in time because it uses the consumption quantities in the initial year as the base.
(True/False)
4.7/5 (35)
TABLE 19-2
The following payoff matrix is given in dollars.
 -Referring to Table 19-2,what is the optimal action using the EOL criterion?
(Multiple Choice)
4.9/5 (40)
TABLE 8-1
A random sample of 100 stores from a large chain of 500 garden supply stores was selected to determine the mean number of lawnmowers sold at an end-of-season clearance sale.The sample results indicated a mean of 6 and a standard deviation of 2 lawnmowers sold.A 95% confidence interval (5.623 to 6.377)was established based on these results.
-Referring to Table 8-1,if the population had consisted of 400 stores,the confidence interval estimate of the mean with finite population correction would have been wider in range.
(True/False)
4.9/5 (42)
TABLE 19-2
The following payoff matrix is given in dollars.
-Referring to Table 19-2,the return to risk ratio for Action B is
(Multiple Choice)
4.8/5 (33)
Filters
- Essay(0)
- Multiple Choice(0)
- Short Answer(0)
- True False(0)
- Matching(0)