Exam 19: Questions that Involve Online Topics
Exam 1: Introduction145 Questions
Exam 2: Organizing and Visualizing Data210 Questions
Exam 3: Numerical Descriptive Measures153 Questions
Exam 4: Basic Probability171 Questions
Exam 5: Discrete Probability Distributions218 Questions
Exam 6: The Normal Distribution and Other Continuous Distributions191 Questions
Exam 7: Sampling and Sampling Distributions197 Questions
Exam 8: Confidence Interval Estimation196 Questions
Exam 9: Fundamentals of Hypothesis Testing: One-Sample Tests165 Questions
Exam 10: Two-Sample Tests210 Questions
Exam 11: Analysis of Variance213 Questions
Exam 12: Chi-Square Tests and Nonparametric Tests201 Questions
Exam 13: Simple Linear Regression213 Questions
Exam 14: Introduction to Multiple Regression355 Questions
Exam 15: Multiple Regression Model Building96 Questions
Exam 16: Time-Series Forecasting168 Questions
Exam 17: Statistical Applications in Quality Management133 Questions
Exam 18: A Roadmap for Analyzing Data54 Questions
Exam 19: Questions that Involve Online Topics321 Questions
Select questions type
If a new machine of a production plant is functioning properly,only 1% of the items produced will be defective.Out of the 1,000 items the plant produces on a single day,the approximate probability that no more than 0.2% of the items will be defective if the new machine is indeed functioning properly is ________.
(Short Answer)
4.7/5  (40)
(40)
TABLE 19-6
A student wanted to find out the optimal strategy to study for a Business Statistics exam.He constructed the following payoff table based on the mean amount of time he needed to study every week for the course and the degree of difficulty of the exam.From the information that he gathered from students who had taken the course,he concluded that there was a 40% probability that the exam would be easy.
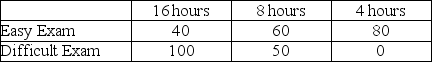 -Referring to Table 19-6,the optimal strategy using the expected monetary value criterion is to study 16 hours per week on average for the exam.
(True/False)
5.0/5 (40)
TABLE 12-2
An agronomist wants to compare the crop yield of 3 varieties of chickpea seeds.She plants all 3 varieties of the seeds on each of 5 different patches of fields.She then measures the crop yield in bushels per acre.Treating this as a randomized block design,the results are presented in the table that follows.
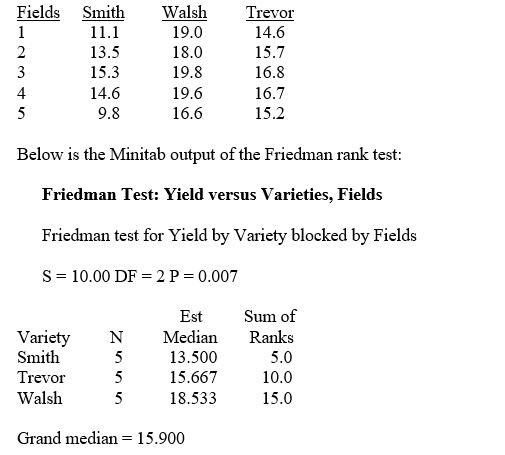 -Referring to Table 12-2,what is the critical value of the Friedman rank test for the difference in the medians at a level of significance of 0.01?
(Short Answer)
4.9/5 (30)
Look at the utility function graphed below and select the type of decision maker that corresponds to the graph. 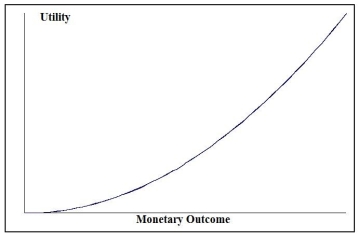
(Multiple Choice)
4.9/5 (37)
TABLE 19-1
The following payoff table shows profits associated with a set of 3 alternatives under 2 possible states of nature. 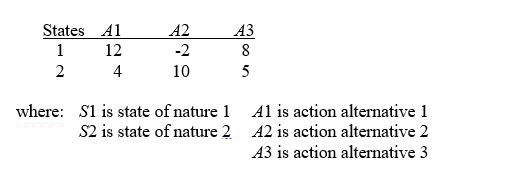 -Referring to Table 19-1,if the probability of S1 is 0.4,then the probability of S2 is
(Multiple Choice)
4.9/5 (35)
TABLE 8-1
A random sample of 100 stores from a large chain of 500 garden supply stores was selected to determine the mean number of lawnmowers sold at an end-of-season clearance sale.The sample results indicated a mean of 6 and a standard deviation of 2 lawnmowers sold.A 95% confidence interval (5.623 to 6.377)was established based on these results.
-Referring to Table 8-1,there are 10 possible samples of 100 stores that can be selected out of the population of 1,000 stores.
(True/False)
4.9/5 (39)
TABLE 12-1
A perfume manufacturer is trying to choose between 2 magazine advertising layouts.An expensive layout would include a small package of the perfume.A cheaper layout would include a "scratch-and-sniff" sample of the product.The manufacturer would use the more expensive layout only if there is evidence that it would lead to a higher approval rate.The manufacturer presents both layouts to 5 groups and determines the approval rating from each group on both layouts.The data are given below.Use this to test whether the median difference in approval rating is different from zero in favor of the more expensive layout with a level of significance of 0.05.
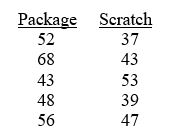 -Referring to Table 12-1,what is the rank of the absolute difference for the last pair of observations?
(Short Answer)
4.7/5 (33)
TABLE 12-2
An agronomist wants to compare the crop yield of 3 varieties of chickpea seeds.She plants all 3 varieties of the seeds on each of 5 different patches of fields.She then measures the crop yield in bushels per acre.Treating this as a randomized block design,the results are presented in the table that follows.
-Referring to Table 12-2,the decision made at a 0.01 level of significance on the Friedman rank test for the difference in medians implies that the 3 medians are not all the same.
(True/False)
4.9/5 (36)
TABLE 19-5
The following payoff table shows profits associated with a set of 2 alternatives under 3 possible events. 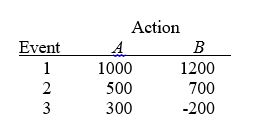 -Referring to Table 19-5,what is the opportunity loss for Action B with Event 3?
(Short Answer)
4.8/5 (36)
To determine the probability of getting fewer than 3 events of interest in a binomial distribution,you will find the area under the normal curve for X = 3.5 and below.
(True/False)
4.9/5 (35)
Based on past experience,only 0.5% of the invoices of a company contain an error.Out of the 1,500 invoices that the company will issue,what is the approximate probability that no more than 4 invoices will contain an error?
(Short Answer)
4.9/5 (43)
TABLE 9-2
An appliance manufacturer claims to have developed a compact microwave oven that consumes a population mean of no more than 250 W.From previous studies,it is believed that power consumption for microwave ovens is normally distributed with a population standard deviation of 15 W.If there is evidence that the population mean consumption is greater than 250 W,the manufacturer will be unable to make the claim.
-Referring to Table 9-2,if you select a sample of 20 compact microwave ovens and are willing to have a level of significance of 0.05,the probability of making a Type II error is ________ if the mean power consumption of all such microwave ovens is in fact 257.3 W.
(Short Answer)
4.9/5 (46)
A simple price index tracks the price of a group of commodities at a given period of time to the price paid for that group of commodities at a particular point of time in the past.
(True/False)
4.9/5 (34)
TABLE 7-1
Times spent studying by students in the week before final exams follow a normal distribution with standard deviation 8 hours.A random sample of 4 students was taken from a population of 50 in order to estimate the mean study time for the population of all students.Use the finite population correction.
-Referring to Table 7-1,what is the probability that the sample mean is more than 3 hours below the population mean?
(Short Answer)
4.9/5 (49)
TABLE 19-6
A student wanted to find out the optimal strategy to study for a Business Statistics exam.He constructed the following payoff table based on the mean amount of time he needed to study every week for the course and the degree of difficulty of the exam.From the information that he gathered from students who had taken the course,he concluded that there was a 40% probability that the exam would be easy.
-Referring to Table 19-6,how many possible events are there?
(Short Answer)
4.9/5 (34)
TABLE 16-1
Given below are the average prices for three types of energy products for five consecutive years.
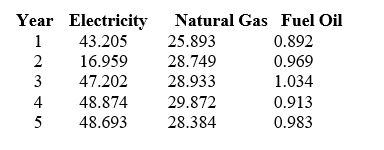 -Referring to Table 16-1,what is the Laspeyres price index for the group of three energy items in year 4 for a family that consumed 15 units of electricity,24 units of natural gas and 200 units of fuel oil in year 1 using year 1 as the base year?
(Short Answer)
4.9/5 (36)
TABLE 16-2
Given below are the prices of a basket of four food items from 2006 to 2010.
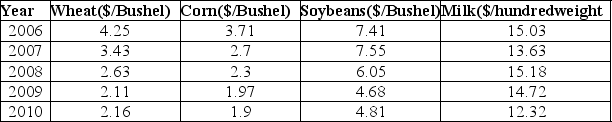 -Referring to Table 16-2,what is the Laspeyres price index for the basket of four food items in 2010 that consisted of 50 bushels of wheat,30 bushels of corn,40 bushels of soybeans and 80 hundredweight of milk in 2006 using 2006 as the base year?
(Short Answer)
4.7/5 (41)
The use of the finite population correction factor when sampling without replacement from finite populations will
(Multiple Choice)
4.8/5 (32)
TABLE 7-2
According to a survey,only 15% of customers who visited the website of a major retail store made a purchase.Random samples of size 50 are selected from a population of 900.Use the finite population correction factor.
-True or ESQ: Referring to Table 7-2,the requirements for using a normal distribution to approximate a binomial distribution is fulfilled.
(True/False)
4.9/5 (36)
If a new machine of a production plant is functioning properly,only 1% of the items produced will be defective.Out of the 1,000 items the plant produces on a single day,the approximate probability that more than 0.2% of the items will be defective if the new machine is indeed functioning properly is ________.
(Short Answer)
4.9/5 (26)
Filters
- Essay(0)
- Multiple Choice(0)
- Short Answer(0)
- True False(0)
- Matching(0)