Exam 19: Questions that Involve Online Topics
Exam 1: Introduction145 Questions
Exam 2: Organizing and Visualizing Data210 Questions
Exam 3: Numerical Descriptive Measures153 Questions
Exam 4: Basic Probability171 Questions
Exam 5: Discrete Probability Distributions218 Questions
Exam 6: The Normal Distribution and Other Continuous Distributions191 Questions
Exam 7: Sampling and Sampling Distributions197 Questions
Exam 8: Confidence Interval Estimation196 Questions
Exam 9: Fundamentals of Hypothesis Testing: One-Sample Tests165 Questions
Exam 10: Two-Sample Tests210 Questions
Exam 11: Analysis of Variance213 Questions
Exam 12: Chi-Square Tests and Nonparametric Tests201 Questions
Exam 13: Simple Linear Regression213 Questions
Exam 14: Introduction to Multiple Regression355 Questions
Exam 15: Multiple Regression Model Building96 Questions
Exam 16: Time-Series Forecasting168 Questions
Exam 17: Statistical Applications in Quality Management133 Questions
Exam 18: A Roadmap for Analyzing Data54 Questions
Exam 19: Questions that Involve Online Topics321 Questions
Select questions type
TABLE 7-1
Times spent studying by students in the week before final exams follow a normal distribution with standard deviation 8 hours.A random sample of 4 students was taken from a population of 50 in order to estimate the mean study time for the population of all students.Use the finite population correction.
-Referring to Table 7-1,what is the probability that the sample mean differs from the population mean by more than 3 hours?
(Short Answer)
4.9/5  (33)
(33)
The Laspeyres price index uses the initial consumption quantities as the weights.
(True/False)
4.7/5 (39)
TABLE 12-1
A perfume manufacturer is trying to choose between 2 magazine advertising layouts.An expensive layout would include a small package of the perfume.A cheaper layout would include a "scratch-and-sniff" sample of the product.The manufacturer would use the more expensive layout only if there is evidence that it would lead to a higher approval rate.The manufacturer presents both layouts to 5 groups and determines the approval rating from each group on both layouts.The data are given below.Use this to test whether the median difference in approval rating is different from zero in favor of the more expensive layout with a level of significance of 0.05.
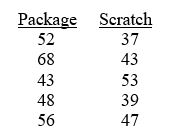 -Referring to Table 12-1,what is the right test to use?
(Multiple Choice)
4.8/5 (37)
TABLE 8-2
A wealthy real estate investor wants to decide whether it is a good investment to build a high-end shopping complex in a suburban county near Chicago.His main concern is the total market value of the 3,605 houses in the suburban county.He commissioned a statistical consulting group to take a sample of 200 houses and obtained a sample mean market price of $225,000 and a sample standard deviation of $38,700.The consulting group also found out that the mean differences between market prices and appraised prices was $125,000 with a standard deviation of $3,400.Also the proportion of houses in the sample that are appraised for higher than the market prices is 0.24.
-Referring to Table 8-2,what will be the 90% confidence interval for the population proportion of houses that will be appraised for higher than the market prices?
(Short Answer)
4.9/5 (37)
At Eastern University,60% of the students are from suburban areas,30% are from rural areas,and 10% are from urban areas.Of the students from the suburban areas,60% are nonbusiness majors.Of the students from the rural areas,70% are nonbusiness majors.Of the students from the urban areas,90% are nonbusiness majors.If a randomly selected student is not a business major,the probability that the student is from the urban area is
(Multiple Choice)
4.9/5 (39)
TABLE 19-1
The following payoff table shows profits associated with a set of 3 alternatives under 2 possible states of nature. 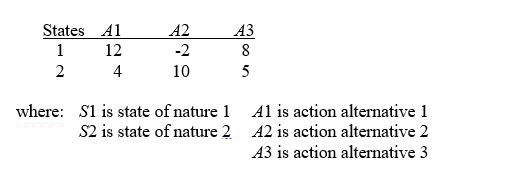 -Referring to Table 19-1,if the probability of S1 is 0.5,then the return to risk ratio for A1 is
(Multiple Choice)
4.9/5 (37)
Unweighted aggregate price indices account for differences in the magnitude of prices per unit and differences in the consumption levels of the items in the market basket.
(True/False)
4.8/5 (30)
TABLE 19-1
The following payoff table shows profits associated with a set of 3 alternatives under 2 possible states of nature.
-Referring to Table 19-1,if the probability of S1 is 0.5,then the expected profit under certainty (EPUC)is
(Multiple Choice)
4.8/5 (32)
TABLE 19-6
A student wanted to find out the optimal strategy to study for a Business Statistics exam.He constructed the following payoff table based on the mean amount of time he needed to study every week for the course and the degree of difficulty of the exam.From the information that he gathered from students who had taken the course,he concluded that there was a 40% probability that the exam would be easy.
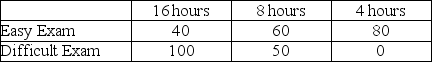 -Referring to Table 19-6,what is the opportunity loss of spending 8 hours per week on average studying for the exam when the exam turns out to be difficult?
(Short Answer)
5.0/5 (27)
If a new machine of a production plant is functioning properly,only 1% of the items produced will be defective.Out of the 1,000 items the plant produces on a single day,the approximate probability that at least 0.2% of the items will be defective if the new machine is indeed functioning properly is ________.
(Short Answer)
5.0/5 (48)
TABLE 9-1
A manufacturer produces light bulbs that have a mean life of at least 500 hours when the production process is working properly.Based on past experience,the population standard deviation is 50 hours and the light bulb life is normally distributed.The operations manager stops the production process if there is evidence that the population mean light bulb life is below 500 hours.
-Referring to Table 9-1,if you select a sample of 100 light bulbs and are willing to have a level of significance of 0.10,the probability of a Type I error is ________ if the population mean bulb life is 510 hours.
(Short Answer)
4.8/5 (37)
TABLE 12-1
A perfume manufacturer is trying to choose between 2 magazine advertising layouts.An expensive layout would include a small package of the perfume.A cheaper layout would include a "scratch-and-sniff" sample of the product.The manufacturer would use the more expensive layout only if there is evidence that it would lead to a higher approval rate.The manufacturer presents both layouts to 5 groups and determines the approval rating from each group on both layouts.The data are given below.Use this to test whether the median difference in approval rating is different from zero in favor of the more expensive layout with a level of significance of 0.05.
-Referring to Table 12-1,the hypotheses that should be used are
(Multiple Choice)
4.9/5 (43)
The changes in the price of the least consumed commodities are overly influential in a weighted aggregate price index.
(True/False)
4.7/5 (36)
TABLE 19-5
The following payoff table shows profits associated with a set of 2 alternatives under 3 possible events. 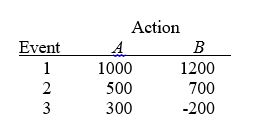 -Referring to Table 19-5,what is the EMV for Action A?
(Short Answer)
4.7/5 (39)
Which of the following is not used to determine observations that have influential effect on the fitted model?
(Multiple Choice)
4.8/5 (34)
TABLE 7-2
According to a survey,only 15% of customers who visited the website of a major retail store made a purchase.Random samples of size 50 are selected from a population of 900.Use the finite population correction factor.
-Referring to Table 7-2,what proportion of the samples will have less than 15% of customers who will make a purchase after visiting the website?
(Short Answer)
4.8/5 (41)
TABLE 19-3
The following information is from 2 investment opportunities.
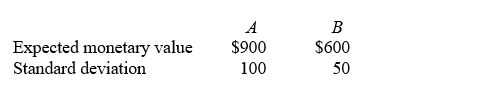 -Referring to Table 19-3,which investment has the optimal coefficient of variation?
(Multiple Choice)
4.9/5 (28)
TABLE 16-2
Given below are the prices of a basket of four food items from 2006 to 2010.
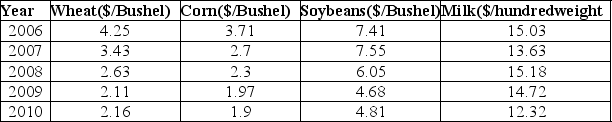 -Referring to Table 16-2,what is the unweighted aggregate price index for the basket of four food items in 2008 using 2006 as the base year?
(Short Answer)
4.9/5 (47)
TABLE 19-4
A stock portfolio has the following returns under the market conditions listed below.
Market Condition Probability Return
Bull 0.4 $200
Stable 0.3 $100
Bear 0.3 -$100
-Referring to Table 19-4,what is the standard deviation?
(Multiple Choice)
4.9/5 (36)
TABLE 6-1
A company has 125 personal computers.The probability that any one of them will require repair on a given day is 0.15.
-Referring to Table 6-1 and assuming that the number of computers that requires repair on a given day follows a binomial distribution,compute the probability that there will be no more than 8 computers that require repair on a given day using a normal approximation.
(Short Answer)
4.8/5 (33)
Filters
- Essay(0)
- Multiple Choice(0)
- Short Answer(0)
- True False(0)
- Matching(0)