Exam 17: Public Goods and Common Resources
Exam 1: First Principles246 Questions
Exam 2: Economic Models: Trade-Offs and Trade72 Questions
Exam 3: Supply and Demand266 Questions
Exam 4: Consumer and Producer Surplus196 Questions
Exam 5: Price Controls and Quotas: Meddling With Markets203 Questions
Exam 6: Elasticity329 Questions
Exam 7: Taxes284 Questions
Exam 8: International Trade265 Questions
Exam 9: Decision Making by Individuals and Firms209 Questions
Exam 10: The Rational Consumer477 Questions
Exam 11: Behind the Supply Curve: Inputs and Costs282 Questions
Exam 12: Perfect Competition and the Supply Curve320 Questions
Exam 13: Monopoly258 Questions
Exam 14: Oligopoly212 Questions
Exam 15: Monopolistic Competition and Product Differentiation223 Questions
Exam 16: Externalities234 Questions
Exam 17: Public Goods and Common Resources237 Questions
Exam 18: The Economics of the Welfare State144 Questions
Exam 19: Factor Markets and the Distribution of Income241 Questions
Exam 20: Uncertainty, Risk, and Private Information199 Questions
Select questions type
(Table: Marginal Benefit from Additional Streetlights) Dave and Art live in a new housing development and would like to have streetlights installed.The table Marginal Benefit from Additional Streetlights shows Dave's and Art's individual marginal benefit of different numbers of streetlights.Suppose that the marginal cost of installing a streetlight is $6.What is the socially optimal number of streetlights in the neighborhood?
(Multiple Choice)
4.8/5  (33)
(33)
Scenario: Alexander and Vanessa Two individuals, Alexander and Vanessa, benefit from scientific research.Alexander's marginal private benefit from such research is given by the equation P = 200 - Q, where Q refers to the amount of research undertaken and P is the price Alexander is willing to pay for such research.Vanessa's marginal private benefit from such research is given by the equation P = 100 - Q.Suppose the marginal social cost of engaging in such research is constant at $100.
(Scenario: Alexander and Vanessa) Given the information in the scenario Alexander and Vanessa, what is the socially optimal amount of scientific research for this economy?
(Multiple Choice)
4.9/5 (39)
Figure: An Individual's Marginal Benefit from a Public Good
(Figure: An Individual's Marginal Benefit from a Public Good) Look at the figure An Individual's Marginal Benefit from a Public Good.Assume that two individuals will share consumption of a public good; each individual has the same marginal benefit curve as the one shown in the figure.If the marginal cost of the good is $24, how much of the public good will be provided by the private market?
(Multiple Choice)
4.9/5 (38)
Figure: Market Failure 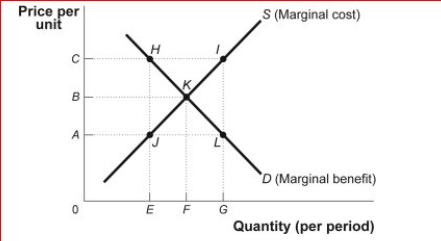
 (Figure: Market Failure) In the figure Market Failure, if production in this competitive market is at quantity F, then:
(Multiple Choice)
4.8/5 (43)
A public good is a good or service for which exclusion is:
(Multiple Choice)
4.8/5 (30)
Bluefin tuna travel in schools throughout the world's oceans.Fishing boats from many nations harvest bluefin tuna as the schools migrate through their national waters.The schools of bluefin tuna are best described as:
(Multiple Choice)
4.8/5 (29)
An individual is more likely to be a free rider when a good is:
(Multiple Choice)
4.9/5 (39)
An artificially scarce good is a good or service for which exclusion is:
(Multiple Choice)
4.7/5 (40)
(Table: Marginal Benefit from Additional Streetlights) Dave and Art live in a new housing development and would like to have streetlights installed.The table Marginal Benefit from Additional Streetlights shows Dave's and Art's individual marginal benefit of different numbers of streetlights.Suppose that the marginal cost of installing a streetlight is $6.If Dave had to pay for streetlights on his own, how many streetlights would there be?
(Multiple Choice)
4.7/5 (32)
Figure: Marginal Social Cost and Supply 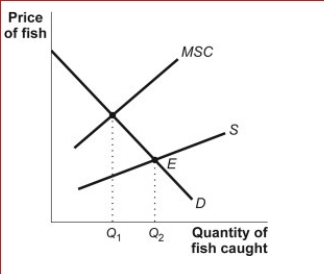
 (Figure: Marginal Social Cost and Supply) In the figure Marginal Social Cost and Supply, the marginal social cost curve lies above the supply curve:
(Multiple Choice)
4.8/5 (29)
Figure: Market Failure
(Figure: Market Failure) Look at the figure Market Failure.Suppose the supply curve represents the marginal cost of providing street lights in a neighborhood that is composed of two people, Ann and Joe.The demand curve represents the marginal benefit that Ann receives from the street lights.Suppose that Joe's marginal benefit from the street lights is a constant amount equal to AC.How much is Ann willing to pay for G street lights?
(Multiple Choice)
4.7/5 (32)
Figure: Market Failure 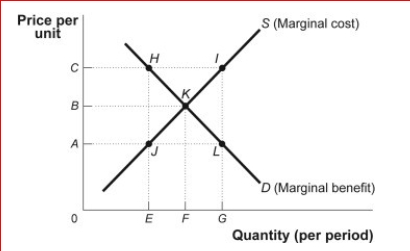
 (Figure: Market Failure) Look at the figure Market Failure.Suppose the supply curve represents the marginal cost of providing street lights in a neighborhood that is composed of two people, Ann and Joe.The demand curve represents the marginal benefit that Ann receives from the street lights.Suppose that Joe's marginal benefit from the street lights is a constant amount equal to AC.The market would provide street lights.The efficient
Quantity of street lights is _.
(Figure: Market Failure) Look at the figure Market Failure.Suppose the supply curve represents the marginal cost of providing street lights in a neighborhood that is composed of two people, Ann and Joe.The demand curve represents the marginal benefit that Ann receives from the street lights.Suppose that Joe's marginal benefit from the street lights is a constant amount equal to AC.The market would provide street lights.The efficient
Quantity of street lights is _.
(Multiple Choice)
4.8/5 (34)
For which of the following goods is the marginal social benefit necessarily greater than the marginal private benefit?
(Multiple Choice)
4.9/5 (36)
The government can intervene to achieve the socially optimal quantity of a common resource by:
(Multiple Choice)
4.8/5 (41)
Figure: Market Failure 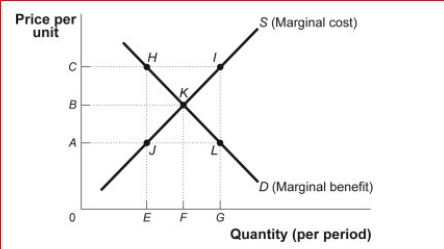
 (Figure: Market Failure) In the figure Market Failure, the equilibrium price is and the
Equilibrium quantity is for a competitive market.
(Figure: Market Failure) In the figure Market Failure, the equilibrium price is and the
Equilibrium quantity is for a competitive market.
(Multiple Choice)
4.9/5 (35)
Filters
- Essay(0)
- Multiple Choice(0)
- Short Answer(0)
- True False(0)
- Matching(0)