Exam 11: Behind the Supply Curve: Inputs and Costs
Exam 1: First Principles246 Questions
Exam 2: Economic Models: Trade-Offs and Trade72 Questions
Exam 3: Supply and Demand266 Questions
Exam 4: Consumer and Producer Surplus196 Questions
Exam 5: Price Controls and Quotas: Meddling With Markets203 Questions
Exam 6: Elasticity329 Questions
Exam 7: Taxes284 Questions
Exam 8: International Trade265 Questions
Exam 9: Decision Making by Individuals and Firms209 Questions
Exam 10: The Rational Consumer477 Questions
Exam 11: Behind the Supply Curve: Inputs and Costs282 Questions
Exam 12: Perfect Competition and the Supply Curve320 Questions
Exam 13: Monopoly258 Questions
Exam 14: Oligopoly212 Questions
Exam 15: Monopolistic Competition and Product Differentiation223 Questions
Exam 16: Externalities234 Questions
Exam 17: Public Goods and Common Resources237 Questions
Exam 18: The Economics of the Welfare State144 Questions
Exam 19: Factor Markets and the Distribution of Income241 Questions
Exam 20: Uncertainty, Risk, and Private Information199 Questions
Select questions type
When marginal cost is below average variable cost, average variable cost must be:
Free
(Multiple Choice)
4.9/5  (26)
(26)
Correct Answer: Verified
C
Marginal cost is the change in:
Free
(Multiple Choice)
4.9/5 (33)
Correct Answer:Verified
B
Figure: Short-Run Costs 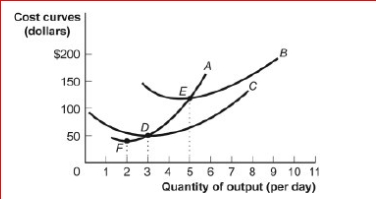
 (Figure: Short-Run Costs) Look at the figure Short-Run Costs.C is the cost curve.
Free
(Multiple Choice)
4.8/5 (34)
Correct Answer:Verified
D
(Figure: The Marginal Product of Labor) Look at the figure The Marginal Product of Labor.The total product for three workers is:
(Multiple Choice)
4.8/5 (39)
(Table: Costs of Birthday Cakes) Annie has a bakery that specializes in birthday cakes, and her variable costs of producing cakes are shown in the table Costs of Birthday Cakes.Assume that her fixed costs are $10.What is the marginal cost of the second cake?
(Multiple Choice)
4.9/5 (39)
Some people use the phrase, "There are too many cooks in the kitchen" to describe any chaotic scene where nothing gets done.Relate this phrase to short-run production functions.
(Essay)
4.9/5 (35)
Figure: Short-Run Costs II
(Figure: Short-Run Costs II) Look at the figure Short-Run Costs II.At six units of output, marginal cost is approximately:
(Multiple Choice)
4.9/5 (38)
A production function that is characterized by economies of scale will not be subject to the operation diminishing returns.True
(True/False)
4.7/5 (29)
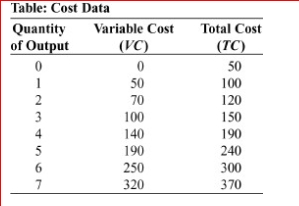
 (Table: Cost Data) Look at the table Cost Data, which shows data for a designer purse factory.The average total cost of producing 6 purses is:
(Multiple Choice)
4.8/5 (25)
(Table: Costs of Producing Bagels) Look at the table Cost of Producing Bagels.Average total cost reaches its minimum value for the bagel.
(Multiple Choice)
4.9/5 (33)
(Table: Costs of Birthday Cakes) Annie has a bakery that specializes in birthday cakes, and her variable costs of producing cakes are shown in the table Costs of Birthday Cakes.Assume that her fixed costs are $10.What is the average variable cost of 4 cakes?
(Multiple Choice)
4.9/5 (32)
Figure: Short-Run Costs 
 (Figure: Short-Run Costs) Look at the figure Short-Run Costs.The vertical difference between curve B
And curve C at any quantity of output is:
(Figure: Short-Run Costs) Look at the figure Short-Run Costs.The vertical difference between curve B
And curve C at any quantity of output is:
(Multiple Choice)
4.9/5 (37)
When marginal cost is above average variable cost, average variable cost must be:
(Multiple Choice)
4.8/5 (31)
Figure: A Firm's Cost Curves  (Figure: A Firm's Cost Curves) Look at the figure A Firm's Cost Curves.The curve X represents the firm's curve.
(Multiple Choice)
4.8/5 (32)
The change in total output resulting from a one-unit increase in the quantity of an input used, holding the quantities of all other inputs constant, is:
(Multiple Choice)
4.8/5 (25)
When a fine caterer produces 30 catered meals, its marginal cost and average variable cost each equal $10.Therefore, assuming normally shaped cost curves, at 29 meals:
(Multiple Choice)
4.8/5 (32)
Filters
- Essay(0)
- Multiple Choice(0)
- Short Answer(0)
- True False(0)
- Matching(0)