Exam 1: First Principles
Exam 1: First Principles246 Questions
Exam 2: Economic Models: Trade-Offs and Trade72 Questions
Exam 3: Supply and Demand266 Questions
Exam 4: Consumer and Producer Surplus196 Questions
Exam 5: Price Controls and Quotas: Meddling With Markets203 Questions
Exam 6: Elasticity329 Questions
Exam 7: Taxes284 Questions
Exam 8: International Trade265 Questions
Exam 9: Decision Making by Individuals and Firms209 Questions
Exam 10: The Rational Consumer477 Questions
Exam 11: Behind the Supply Curve: Inputs and Costs282 Questions
Exam 12: Perfect Competition and the Supply Curve320 Questions
Exam 13: Monopoly258 Questions
Exam 14: Oligopoly212 Questions
Exam 15: Monopolistic Competition and Product Differentiation223 Questions
Exam 16: Externalities234 Questions
Exam 17: Public Goods and Common Resources237 Questions
Exam 18: The Economics of the Welfare State144 Questions
Exam 19: Factor Markets and the Distribution of Income241 Questions
Exam 20: Uncertainty, Risk, and Private Information199 Questions
Select questions type
Economists generally believe that a country should specialize in the production of a good or service if:
A.the production possibility frontier is larger than that of any other country.
B.the production possibility frontier is smaller than that of any other country.
C.the country can produce the product using more resources than any other country.
the country can produce the product while forgoing fewer alternative products than any other country.
Free
(Essay)
4.8/5  (40)
(40)
Correct Answer: Verified
the country can produce the product while forgoing fewer alternative products than any other country.
Bangladesh produces much of the clothing we wear because it is more productive in producing clothes than we are in the United States.
Free
(True/False)
4.9/5 (29)
Correct Answer:Verified
False
Figure: Tom's Production Possibilities
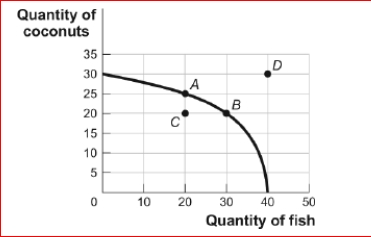
 (Figure: Tom's Production Possibilities) Look at the figure Tom's Production Possibilities.In the figure, the opportunity cost for Tom to move from point C on the curve to point A is:
A.10 coconuts.
B.30 fish.
C.5 coconuts.
D.There is no opportunity cost in terms of fish.
(Figure: Tom's Production Possibilities) Look at the figure Tom's Production Possibilities.In the figure, the opportunity cost for Tom to move from point C on the curve to point A is:
A.10 coconuts.
B.30 fish.
C.5 coconuts.
D.There is no opportunity cost in terms of fish.
Free
(Essay)
4.8/5 (27)
Correct Answer:Verified
There is no opportunity cost in terms of fish.
The concept of comparative advantage is based upon:
A.absolute labor productivity.
B.relative labor costs.
C.dollar prices of labor.
D.relative opportunity costs.
(Essay)
4.9/5 (34)
Figure: Production Possibilities and Circular-Flow Diagram
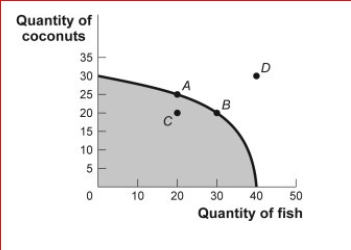
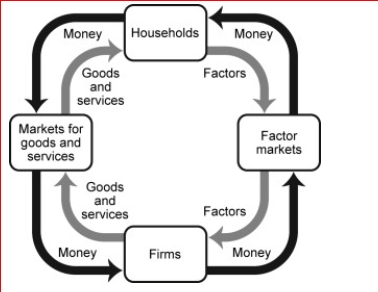
 (Figure: Production Possibilities and Circular-Flow Diagram) Look at the figure Production Possibilities and Circular-Flow Diagram.Assume the two figures represent the same economy.Suppose that in the circular-flow diagram there is a significant decrease in the amount of labor flowing to the firms that produce coconuts.If all other variables remain unchanged, this adjustment in the economy would be best represented in the production possibilities figure by a move from point A toward:
A.point A (no movement would occur).
B.point B (an increase in fish production).
C.point C (a decrease in coconut production).
D.point D (an outward shift of the entire curve).
(Figure: Production Possibilities and Circular-Flow Diagram) Look at the figure Production Possibilities and Circular-Flow Diagram.Assume the two figures represent the same economy.Suppose that in the circular-flow diagram there is a significant decrease in the amount of labor flowing to the firms that produce coconuts.If all other variables remain unchanged, this adjustment in the economy would be best represented in the production possibilities figure by a move from point A toward:
A.point A (no movement would occur).
B.point B (an increase in fish production).
C.point C (a decrease in coconut production).
D.point D (an outward shift of the entire curve).
(Essay)
4.8/5 (33)
(Table: Production of Good Z and Good X in Urbanville) Look at the table Production of Good Z and Good X in Urbanville.If this represents the production possibility frontier and Urbanville is currently producing at combination F, what is the opportunity cost of a move to combination E?
A.5 of Z
B.20 of Z
C.25 of X
D.0 of X
(Essay)
4.9/5 (41)
Alexander has a straight-line, or linear, production possibility frontier when he produces soybeans and corn.If he uses all of his resources to grow soybeans, he can produce 200 bushels of soybeans; if he uses all of his resources for corn production, he can produce 400 bushels of corn.Which of the following combinations of corn and soybeans are not possible for him to produce?
A.200 bushels of soybeans and zero bushels of corn
B.600 bushels of corn and 200 bushels of soybeans
C.400 bushels of corn and zero bushels of soybeans
D.100 bushels of soybeans and 200 bushels of corn
(Essay)
4.9/5 (39)
Figure: Consumer and Capital Goods
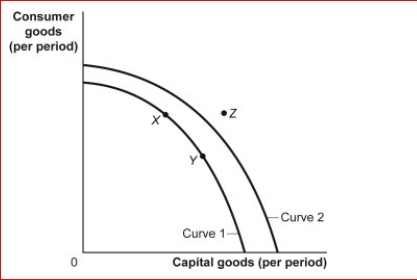
 (Figure: Consumer and Capital Goods) Look at the figure Consumer and Capital Goods.The movement from curve 1 to curve 2 indicates:
A.a growing ability of the economy to produce capital and consumer goods.
B.going from unemployment to full employment.
C.a decrease in the factors of production.
D.a shift of the production possibility frontier toward producing fewer goods.
(Figure: Consumer and Capital Goods) Look at the figure Consumer and Capital Goods.The movement from curve 1 to curve 2 indicates:
A.a growing ability of the economy to produce capital and consumer goods.
B.going from unemployment to full employment.
C.a decrease in the factors of production.
D.a shift of the production possibility frontier toward producing fewer goods.
(Essay)
4.9/5 (36)
Technological improvements will:
A.leave the production possibility frontier unchanged.
B.shift the production possibility frontier inward.
C.shift the production possibility frontier outward.
D.necessarily lead to increased unemployment.
(Essay)
4.8/5 (39)
Figure: Guns and Butter
(Figure: Guns and Butter) Look at the figure Guns and Butter.The combination of guns and butter at point H:
A.can be attained but would cost too much.
B.cannot be attained, given the level of technology and the factors of production available.
C.has no meaning, since it does not relate to the preferences of
D.consumers.is attainable but would increase unemployment.
(Essay)
4.9/5 (41)
If an economy is producing a level of output that is on its production possibility frontier, the economy has:
A.idle resources.
B.idle resources but is using resources efficiently.
C.no idle resources but is using resources inefficiently.
D.no idle resources and is using resources efficiently.
(Essay)
4.8/5 (43)
The effect of a tremendous natural disaster can be shown by:
A.a point inside of the production possibility frontier.
B.an outward shift of the production possibility frontier.
C.a movement from one point to another along the production possibility frontier.
D.an inward shift of the production possibility frontier.
(Essay)
4.8/5 (27)
If they bake only cakes, in a single day George can bake 10 cakes and Greta can bake 5 cakes.If they make only pies, in a single day George can bake 10 pies while Greta can bake 4 pies.We know that:
A.George has an absolute advantage and a comparative advantage in making cakes.
B.George has an absolute advantage and a comparative advantage in making pies.
C.Greta has an absolute advantage and a comparative advantage in making cakes.
D.Greta has an absolute advantage and a comparative advantage in making pies.
(Essay)
4.7/5 (32)
Figure: Consumer and Capital Goods
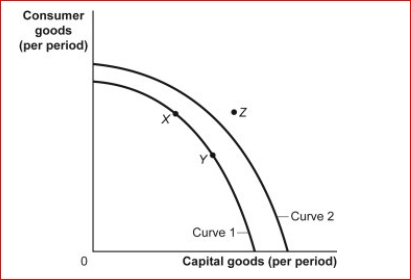
 (Figure: Consumer and Capital Goods) Look at the figure Consumer and Capital Goods.If the economy is operating at point Y and its relevant production possibility frontier is curve 1, this means that:
A.the economy is at full employment and is efficient.
B.the economy is less than fully employed.
C.the economy is not efficient.
D.economic growth is not possible in the future.
(Figure: Consumer and Capital Goods) Look at the figure Consumer and Capital Goods.If the economy is operating at point Y and its relevant production possibility frontier is curve 1, this means that:
A.the economy is at full employment and is efficient.
B.the economy is less than fully employed.
C.the economy is not efficient.
D.economic growth is not possible in the future.
(Essay)
4.9/5 (41)
If an economy is producing at a point on its production possibilities frontier:
(Multiple Choice)
4.8/5 (40)
Suppose residents of Montana operate on their production possibility frontier and want to see increased wheat production as well as an increase in the production of fly-fishing rods.According to the production possibility frontier, this cannot happen without new resources or technological improvement.
(True/False)
4.8/5 (40)
(Table: Trade-off of Study Time and Leisure Time) Look at the table Trade-off of Study Time and Leisure Time.A student sleeps 8 hours per day and divides the remaining time between study time and leisure time.The table shows the combinations of study and leisure time that can be produced in the 16 waking hours of each day.Suppose the student completes a speed-reading course that allows him to do the same amount of studying in half as many hours.Which of the following is now true of his opportunity costs?
A.The opportunity cost of leisure has increased.
B.The opportunity cost of studying has increased.
C.The opportunity cost of leisure has decreased.
D.There is no change in the opportunity costs.
(Essay)
4.8/5 (34)
(Table: Production Possibilities Schedule II) Look at the table Production Possibilities Schedule II.If the economy is producing at alternative Y, the opportunity cost to it of producing at Z is units of consumer goods per period.
A.1
B.6
C.8
D.14
(Essay)
4.7/5 (30)
Assume an economy is operating on its production possibility frontier, which shows the production of military and civilian goods.If the output of military goods is increased, the output of civilian goods:
A.will increase, too.
B.will not change.
C.must decrease.
D.may increase or decrease.
(Essay)
4.9/5 (36)
Figure: Comparative Advantage
Eastland and Westland produce only two goods, boxes of peaches and boxes of oranges, and this figure shows each nation's production possibility frontier for the two goods.
(Figure: Comparative Advantage) Look at the figure Comparative Advantage.The opportunity cost of producing 1 box of peaches for Eastland is:
A.1 box of oranges.
B.1/4 box of oranges.
C.4 boxes of oranges.
D.10 boxes of oranges.
(Essay)
4.9/5 (32)
Filters
- Essay(0)
- Multiple Choice(0)
- Short Answer(0)
- True False(0)
- Matching(0)