Exam 11: Behind the Supply Curve: Inputs and Costs
Exam 1: First Principles246 Questions
Exam 2: Economic Models: Trade-Offs and Trade72 Questions
Exam 3: Supply and Demand266 Questions
Exam 4: Consumer and Producer Surplus196 Questions
Exam 5: Price Controls and Quotas: Meddling With Markets203 Questions
Exam 6: Elasticity329 Questions
Exam 7: Taxes284 Questions
Exam 8: International Trade265 Questions
Exam 9: Decision Making by Individuals and Firms209 Questions
Exam 10: The Rational Consumer477 Questions
Exam 11: Behind the Supply Curve: Inputs and Costs282 Questions
Exam 12: Perfect Competition and the Supply Curve320 Questions
Exam 13: Monopoly258 Questions
Exam 14: Oligopoly212 Questions
Exam 15: Monopolistic Competition and Product Differentiation223 Questions
Exam 16: Externalities234 Questions
Exam 17: Public Goods and Common Resources237 Questions
Exam 18: The Economics of the Welfare State144 Questions
Exam 19: Factor Markets and the Distribution of Income241 Questions
Exam 20: Uncertainty, Risk, and Private Information199 Questions
Select questions type
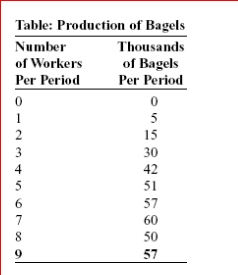
 (Table: Production of Bagels) Look at the table Production of Bagels.The marginal product of the third worker is bagels.
(Multiple Choice)
4.7/5  (31)
(31)
Figure: Short-Run Costs 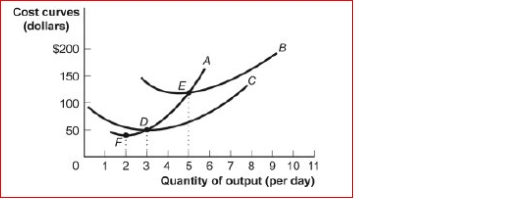 (Figure: Short-Run Costs) Look at the figure Short-Run Costs.B is the cost curve.
(Multiple Choice)
4.8/5 (39)
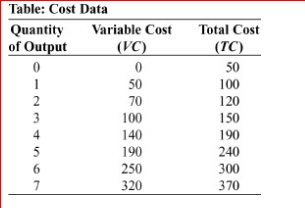
 (Table: Cost Data) Look at the table Cost Data, which shows data for a designer purse factory.The average total cost of producing 4 purses is:
(Multiple Choice)
4.9/5 (30)
When diminishing returns exist, then the marginal cost curve is upward-sloping.False
(True/False)
4.9/5 (36)
The curve that illustrates the relationship between output and average total cost when the fixed cost has been chosen to minimize average total cost for each level of output is the:
(Multiple Choice)
4.8/5 (36)
A is an organization that produces goods or services for sale.
(Multiple Choice)
4.9/5 (33)
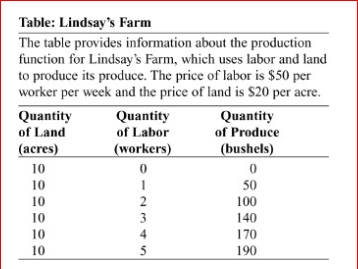
 (Table: Lindsay's Farm) Look at the table Lindsay's Farm.Lindsay's variable costs of production:
(Multiple Choice)
4.8/5 (42)
In the short run, the average total cost curve always lies above the average variable cost curve.False
(True/False)
4.8/5 (39)
(Table: Workers and Output) After graduation you achieve your dream of opening your own art shop that specializes in selling mud statues.You pay $10 per day on a loan from your uncle, and you pay $10 per day to each of your workers (who make the mud statues).After careful study, you determine the production information in the table.The variable cost of producing 25 statues is
(Multiple Choice)
4.9/5 (39)
A university that benefits from lower costs per enrolled student as it builds more buildings and enrolls more students is an example of a service provider with:
(Multiple Choice)
4.9/5 (35)
A farm can produce 1,000 bushels of wheat per year with two workers and 1,300 bushels of wheat per year with four workers.The marginal product of the fourth worker is:
(Multiple Choice)
4.7/5 (34)
As production increases and the fixed cost is divided by larger quantities of output, this leads to lower average fixed cost.This is referred to as the effect.
(Multiple Choice)
4.9/5 (34)
Diminishing returns are one explanation for diseconomies of scale.True
(True/False)
4.9/5 (38)
For every restaurant in Cleveland, the average total cost curve ________ at levels of output, then ________ at levels.
(Multiple Choice)
4.7/5 (28)
Figure: The Marginal Product of Labor 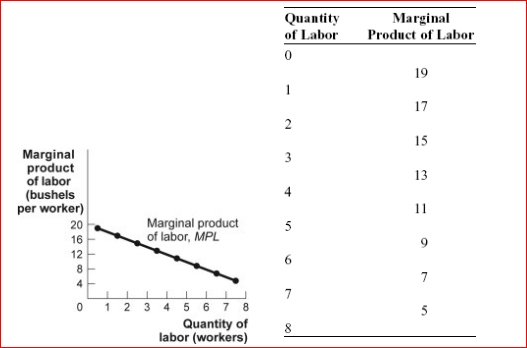
 (Figure: The Marginal Product of Labor) Look at the figure The Marginal Product of Labor.The total product of labor for eight workers is:
(Multiple Choice)
4.7/5 (23)
Figure: Short-Run Costs 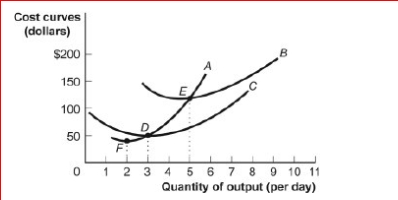
 (Figure: Short-Run Costs) Look at the figure Short-Run Costs.At seven units of output, average fixed cost is approximately ________, and average variable cost is approximately _.
(Multiple Choice)
4.8/5 (35)
(Table: Cost Data) Look at the table Cost Data.When the purse factory produces five units of output (purses), which of the following is true about the firm's cost curves?
(Multiple Choice)
4.8/5 (35)
(Table: Output and Costs) Look at the table Output and Costs.Using the information in the table, when output increases from one to two, marginal cost equals:
(Multiple Choice)
4.8/5 (24)
Filters
- Essay(0)
- Multiple Choice(0)
- Short Answer(0)
- True False(0)
- Matching(0)